Mississippi Science ENV.1.6
The Standard
- ENV.1
- Students will investigate the interdependence of diverse living organisms and their interactions with the components of the biosphere.
Use mathematics, graphics, and informational text to determine how population density-dependent and density-independent limiting factors affect populations and diversity within ecosystems. Use technology to illustrate and compare a variety of population-growth curves.
2026 Mississippi College- and Career-Readiness Standards for Science · Biosphere and Biodiversity
Teacher's field guide
What This Standard Means
What Students Need to Do
- Students calculate population changes from data and use graphs and short reports to identify what limits growth. They distinguish pressures that increase with crowding, such as disease, from events such as floods. They use a spreadsheet to compare growth curves and predict changes in species diversity.
What Mastery Looks Like
- Given population counts, students calculate growth rates and recognize rapid growth, leveling off, or decline on a graph. They explain why disease may spread faster in a crowded population, why a flood can affect populations at any density, and how either could change the number of species.
Common Misconceptions
- Students may call any factor that lowers a population density-dependent, even a flood. They may think a leveling curve means animals stopped reproducing, or assume fewer animals always means fewer species.
How to Assess It
- Have students plot two four-year population records: 10, 20, 40, 80 and 10, 18, 25, 27. Ask which curve levels off and how disease versus a flood could change population size and the number of species.
Lesson moves
Ways to Teach It
In two trials, scatter 20 and 60 beans on the same paper habitat; remove touching beans and compare survival percentages.
Ask, 'Why could disease spread faster among crowded rabbits while a wildfire might kill rabbits even when they are scarce?'
In a spreadsheet, graph 10, 20, 40, 80 and 10, 18, 25, 27; label each growth curve and compare its shape.
Read a park notice saying 'Too many deer eat saplings; a storm toppled trees,' then predict changes in plant diversity.
Free download
Printable ENV.1.6 Worksheet
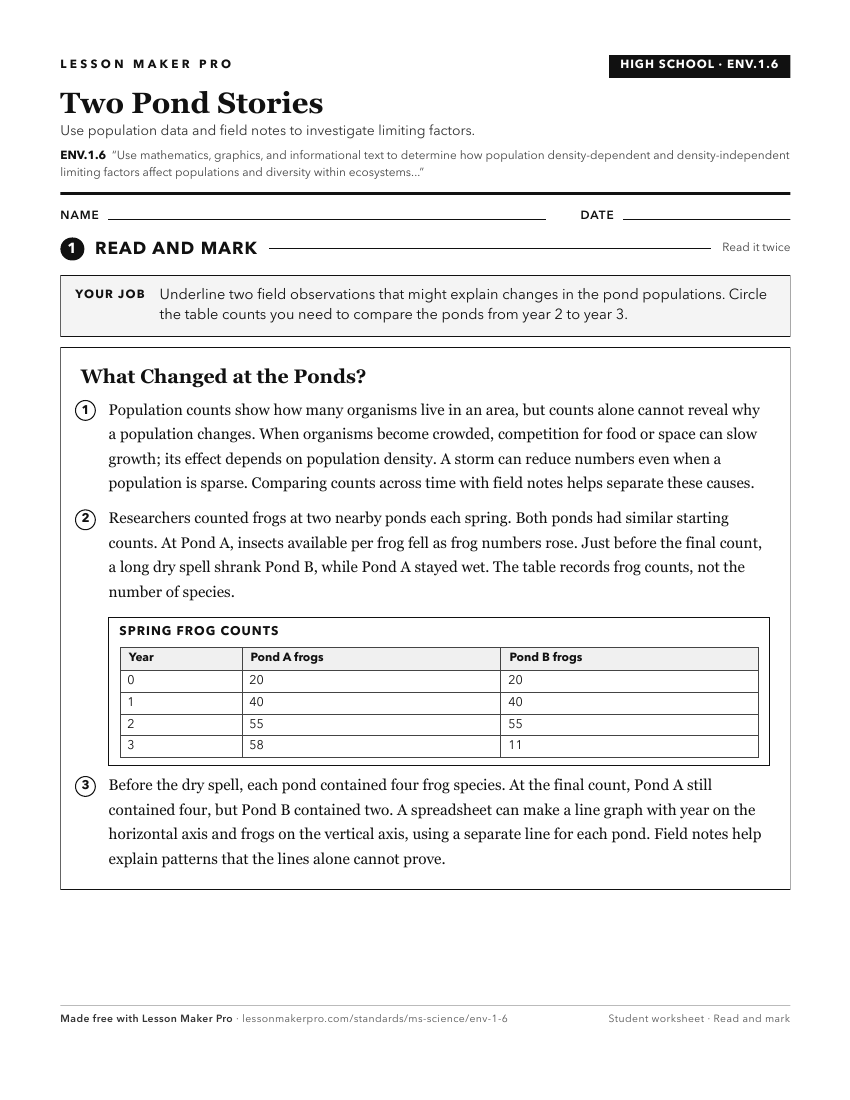
A ready-to-print activity worksheet aligned to ENV.1.6, with an answer key for the teacher on its own page. No account needed.
PDF, US Letter, prints cleanly in black and white.
Download the worksheetKeep exploring
Related Standards
- L.8.4B.1
Analyze and interpret data (e.g., pictures, graphs) to explain how natural selection may lead to increases and decreases in specific traits in populations over ...
- L.6.3
Students will demonstrate an understanding of the relationships between survival, environmental changes, and diversity as they relate to the interactions of org...
- BIO.5.6
Analyze and interpret population data to define limiting factors, both density-dependent and density-independent. Use graphical representations (growth curves) ...
- L.6.3.3
Analyze cause and effect relationships to explore how changes in the physical environment (limiting factors, natural disasters) can lead to population changes w...
Turn this exact standard into a lesson
Grade, subject, topic, and the complete standard are prefilled. Create one free, no account needed.
Also for this standard:Make a WorksheetMake a QuizMake a Sub Lesson