Mississippi Science ESS.1A.3
The Standard
- ESS.1A
- Students will develop an understanding of the universe, its development, immense size, and composition.
Organize and interpret data sets for patterns and trends to compare and contrast stellar evolution in order to explain and communicate how a star changes during its life.
2026 Mississippi College- and Career-Readiness Standards for Science · Earth in the Universe
Teacher's field guide
What This Standard Means
What Students Need to Do
- Students organize data on stars' starting masses, temperatures, brightness, and life stages. They look for patterns, compare stars of different masses, and use the data to explain how stars change over time.
What Mastery Looks Like
- A student can use a graph to show that massive stars are brighter but have shorter lives. They can explain that a Sun-sized star ends as a white dwarf, while a much more massive star may end as a neutron star or black hole.
Common Misconceptions
- Students may think every star follows the same path or ends as a black hole. They may also assume a star with more fuel must live longer, without considering how quickly it uses that fuel.
How to Assess It
- Exit ticket: Show two records: 1 solar mass, 10 billion main-sequence years, white dwarf; 15 solar masses, 10 million years, neutron star. Ask which star changes faster and how their endings differ, citing both records.
Lesson moves
Ways to Teach It
Give pairs printed temperature and brightness data for two star masses; have them plot each star's life stages on graph paper.
Ask why a 15-solar-mass star dies sooner than a Sun-sized star; have students cite brightness and lifetime values.
Deal shuffled cards labeled with starting mass, temperature, brightness, and stage; have teams build two timelines and defend their choices.
Show a printed star-cluster diagram; have students circle where stars leave the main sequence and explain what that tells astronomers about the cluster's age.
Free download
Printable ESS.1A.3 Worksheet
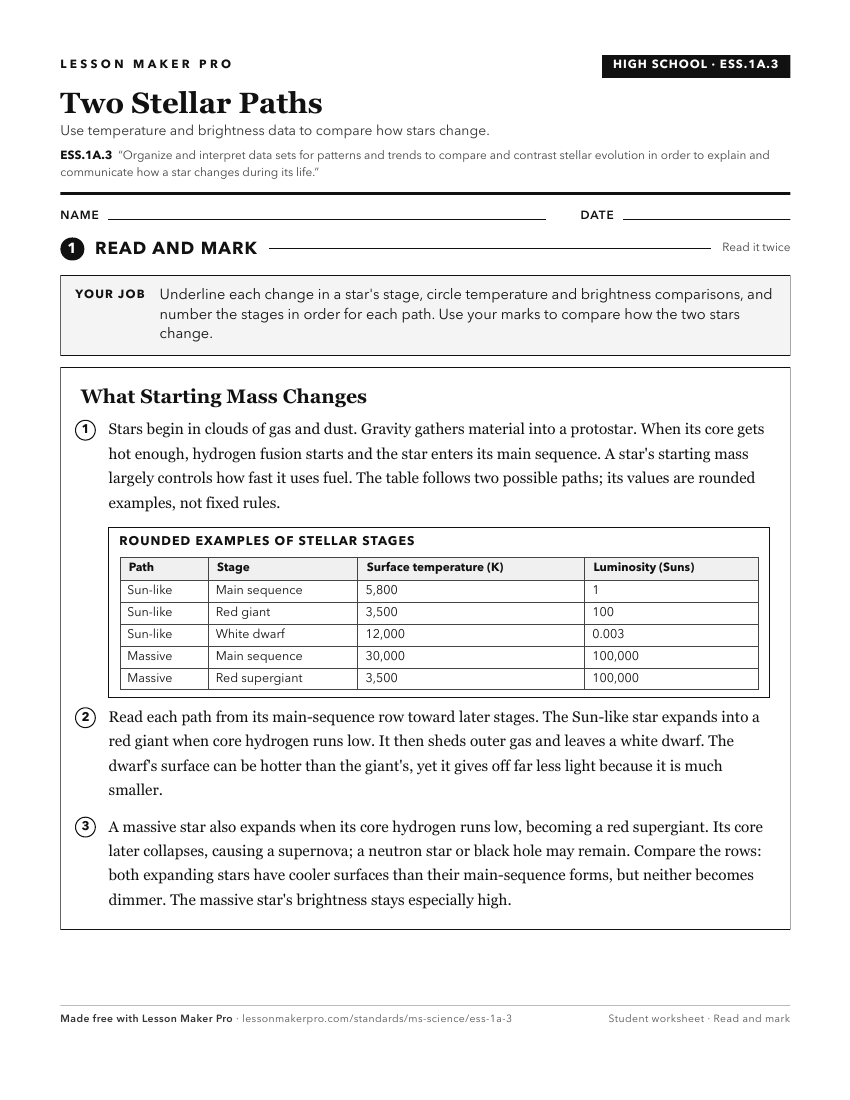
A ready-to-print activity worksheet aligned to ESS.1A.3, with an answer key for the teacher on its own page. No account needed.
PDF, US Letter, prints cleanly in black and white.
Download the worksheetKeep exploring
Related Standards
- L.8.4B.1
Analyze and interpret data (e.g., pictures, graphs) to explain how natural selection may lead to increases and decreases in specific traits in populations over ...
- E.6.8.7
Analyze and interpret data from the surface features of the Sun (e.g., photosphere, corona, sunspots, prominences, and solar flares) to predict how these featur...
- ESS.1A.2
Interpret information from the Hertzsprung -Russell diagram to differentiate types of stars, including our sun, according to size, magnitude, and classification...
- ESS.2A.1
Analyze and interpret data to explain and communicate the differentiation of Earth’s internal chemical structure (e.g., core, mantle, and crust) using the produ...
Turn this exact standard into a lesson
Grade, subject, topic, and the complete standard are prefilled. Create one free, no account needed.
Also for this standard:Make a WorksheetMake a QuizMake a Sub Lesson