Maryland Math 8.AT.D.10.a
The Standard
- 8.AT.D.10
- Construct and interpret a linear function to model a relationship between two quantities.
Given two input-output pairs, a graph, a table, or a description of a relationship, determine the rate of change and initial value and write the linear equation that models the situation.
Maryland College and Career Ready Standards for Mathematics (2025) · MODEL WITH FUNCTIONS.
Teacher's field guide
What This Standard Means
What Students Need to Do
- Students use two points, a graph, a table, or a description to find the change in output for each one-unit change in input. They find the output when the input is zero. Then they write an equation in the form y = mx + b.
What Mastery Looks Like
- A student can use the points (2, 7) and (5, 16) to find a rate of 3 and an initial value of 1. They write y = 3x + 1 and check that both points fit.
Common Misconceptions
- Students may divide the change in input by the change in output, reversing the rate. They may treat the first output in a table as the initial value, even when its input is not zero.
How to Assess It
- Give students the points (2, 7) and (5, 16). Ask: What are the rate of change, initial value, and equation? Show how you found them.
Lesson moves
Ways to Teach It
Use linking cubes: start with two at round zero, add three per round, record a table, and write the equation.
Ask: A tank starts with 18 gallons and gains four gallons each minute. What do 18 and four mean in the equation?
Deal cards for three linear rules as tables, graphs, and equations; teams match sets and explain each rate and initial value.
Use a $5 parking entry fee plus $2 per hour; students write a cost equation and find the charge after four hours.
Free download
Printable 8.AT.D.10.a Worksheet
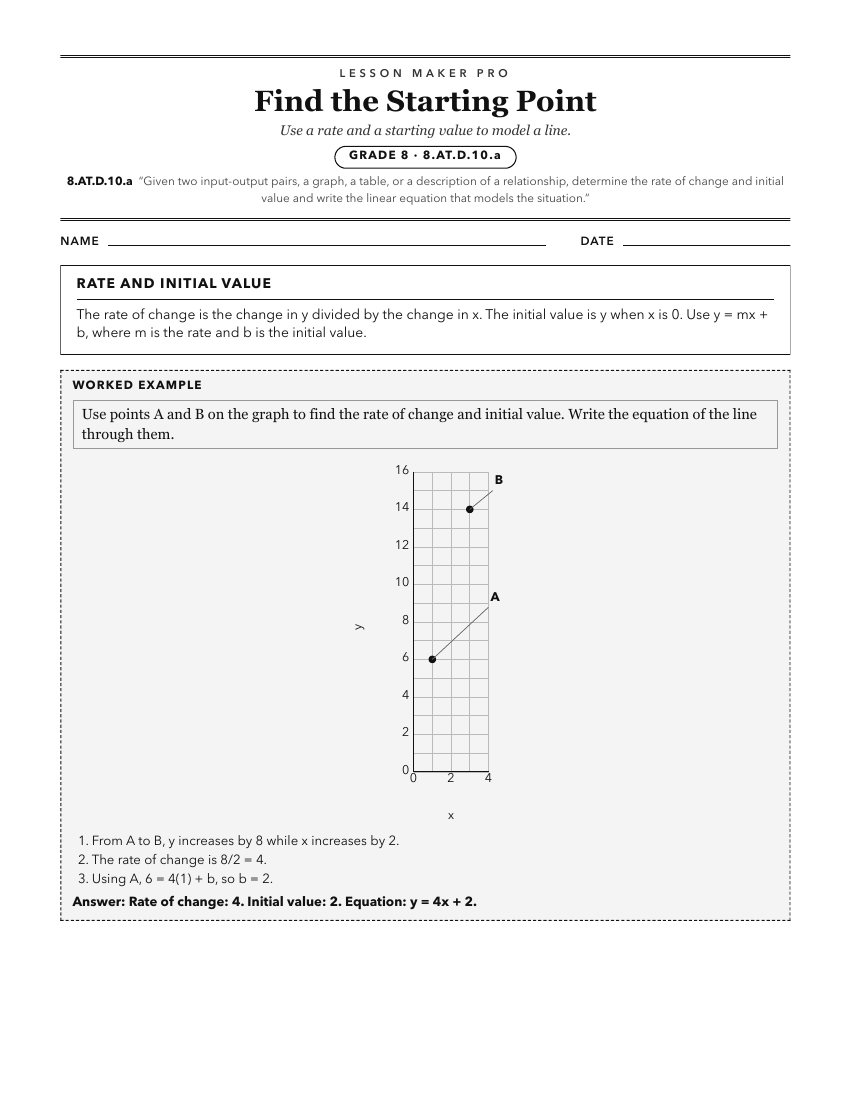
A ready-to-print activity worksheet aligned to 8.AT.D.10.a, with an answer key for the teacher on its own page. No account needed.
PDF, US Letter, prints cleanly in black and white.
Download the worksheetKeep exploring
Related Standards
- 8.AT.C.8
Identify whether a function is linear or non-linear given equations, graphs, or input-output pairs, and provide a justification using reasoning about the consta...
- 8.AT.D.10
Construct and interpret a linear function to model a relationship between two quantities.
- 5.AT.B.3.c
Use tables, ordered pairs, and graphs to represent the relationship between quantities.
- 8.AT.C.7
Compare the properties (i.e., rate of change, intercepts) of two linear functions each represented in a different way (algebraically, graphically, numerically i...
Turn this exact standard into a lesson
Grade, subject, topic, and the complete standard are prefilled. Create one free, no account needed.
Also for this standard:Make a WorksheetMake a QuizMake a Sub Lesson