Maryland Math 8.AT.C.7
The Standard
Compare the properties (i.e., rate of change, intercepts) of two linear functions each represented in a different way (algebraically, graphically, numerically in tables, or by narrative descriptions).
Maryland College and Career Ready Standards for Mathematics (2025) · REASON ABOUT FUNCTIONS.
Teacher's field guide
What This Standard Means
What Students Need to Do
- Students find rates of change and intercepts in equations, graphs, tables, and stories. They compare two linear functions shown in different forms and explain their answers with numbers.
What Mastery Looks Like
- Given a graph and a table, a student can find each rate from the change in y divided by the change in x. They can find each y-intercept, even if the table does not show x = 0, and say which function starts higher or changes faster.
Common Misconceptions
- Students may call the first value in a table the y-intercept even when x is not zero. They may use the change in y alone as the rate, or assume the function that starts higher also grows faster.
How to Assess It
- Exit ticket: Compare y = 2x + 3 with the table (0, 5), (2, 11), (4, 17). Which has the greater rate, and which has the greater y-intercept? Show how you know.
Lesson moves
Ways to Teach It
Give pairs a printed graph and a table; use colored pencils to mark equal x-steps, y-changes, and y-intercepts on each.
Draw the line through (0, 6) and (2, 8); show a table with (2, 8), (4, 12); ask which starts higher.
Deal y = 2x + 4 cards and (0, 1), (1, 4) table cards; race to compare rates and intercepts.
Compare a taxi's $5 pickup fee plus $2 per mile with a fare table showing $3 at zero miles and $6 at one mile.
Free download
Printable 8.AT.C.7 Worksheet
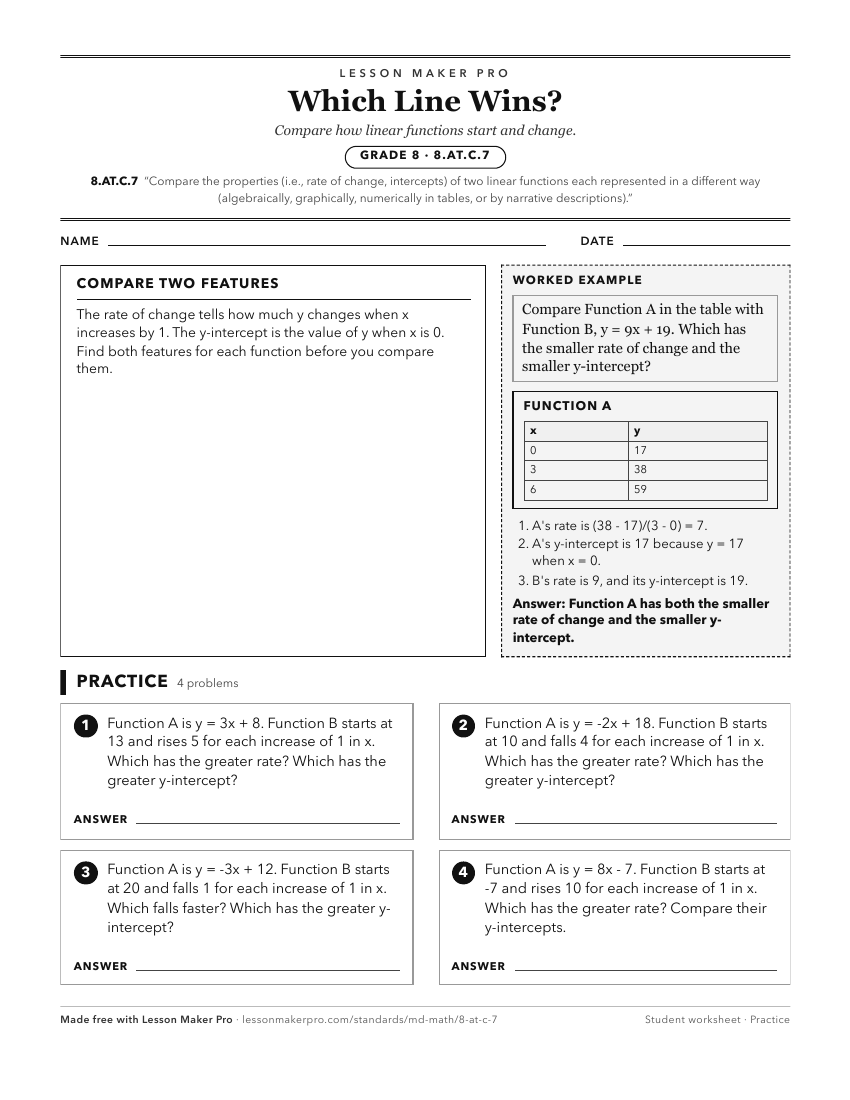
A ready-to-print activity worksheet aligned to 8.AT.C.7, with an answer key for the teacher on its own page. No account needed.
PDF, US Letter, prints cleanly in black and white.
Download the worksheetKeep exploring
Related Standards
- 8.AT.C.8
Identify whether a function is linear or non-linear given equations, graphs, or input-output pairs, and provide a justification using reasoning about the consta...
- 8.AT.D.10.a
Given two input-output pairs, a graph, a table, or a description of a relationship, determine the rate of change and initial value and write the linear equation...
- 8.AT.A.1.b
Compare proportional relationships represented in different forms (e.g., graphs, equations, and tables) by analyzing their slopes.
Turn this exact standard into a lesson
Grade, subject, topic, and the complete standard are prefilled. Create one free, no account needed.
Also for this standard:Make a WorksheetMake a QuizMake a Sub Lesson