Maryland Math 8.AT.C.8
The Standard
Identify whether a function is linear or non-linear given equations, graphs, or input-output pairs, and provide a justification using reasoning about the constant rate of change and its relationship to proportional reasoning.
Maryland College and Career Ready Standards for Mathematics (2025) · REASON ABOUT FUNCTIONS.
Teacher's field guide
What This Standard Means
What Students Need to Do
- Students decide whether an equation, graph, or set of input-output pairs shows a constant rate of change. They explain that proportional relationships are linear and pass through (0, 0), but not every linear relationship is proportional.
What Mastery Looks Like
- Given the pairs (0, 3), (2, 7), and (4, 11), a student finds a rate of 2 per input unit and calls the relationship linear but not proportional. They can check a graph or equation for a constant rate and show where the rate changes in a nonlinear relationship.
Common Misconceptions
- Students may compare output changes without checking whether the input steps are equal. Some call every straight-line graph proportional, even when it does not pass through (0, 0). Others assume any equation with x in it is linear, including y = x².
How to Assess It
- Exit ticket: Classify y = 2x + 3 and the pairs (0, 0), (1, 2), (2, 5) as linear or nonlinear. Show the rate for each and say whether either is proportional.
Lesson moves
Ways to Teach It
Place sticky notes for y = 2x + 3 and y = x² on a wall grid, then trace each pattern with string.
Ask, 'Does every straight-line graph show a proportional relationship?' Have pairs compare y = 2x and y = 2x + 3.
Play Rate Detective: give pairs cards with equations, graphs, and tables to sort by constant or changing rate, then defend each choice.
Graph a $5 taxi booking fee plus $3 per mile alongside a $3-per-mile scooter rental, then check which cost is proportional.
Free download
Printable 8.AT.C.8 Worksheet
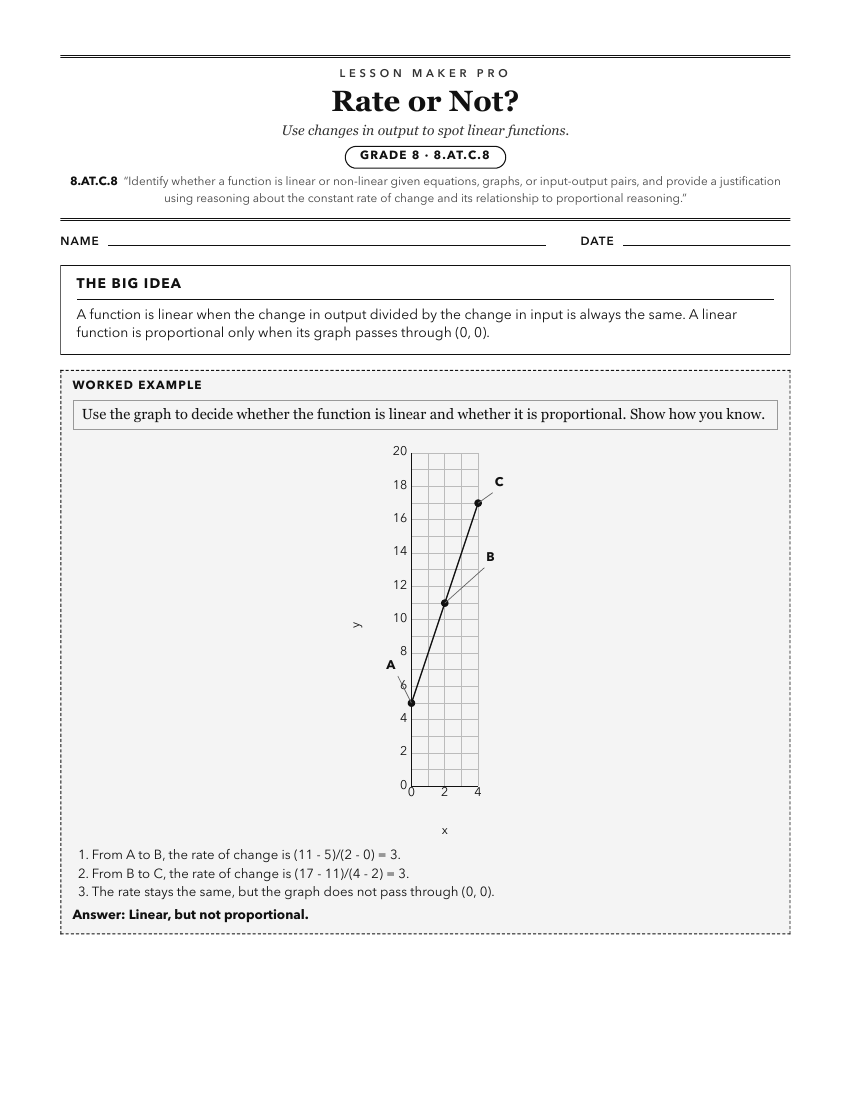
A ready-to-print activity worksheet aligned to 8.AT.C.8, with an answer key for the teacher on its own page. No account needed.
PDF, US Letter, prints cleanly in black and white.
Download the worksheetKeep exploring
Related Standards
- 8.AT.D.10.a
Given two input-output pairs, a graph, a table, or a description of a relationship, determine the rate of change and initial value and write the linear equation...
- 8.AT.A.2
Use proportional reasoning to identify slope and represent linear relationships.
- 8.AT.C.7
Compare the properties (i.e., rate of change, intercepts) of two linear functions each represented in a different way (algebraically, graphically, numerically i...
Turn this exact standard into a lesson
Grade, subject, topic, and the complete standard are prefilled. Create one free, no account needed.
Also for this standard:Make a WorksheetMake a QuizMake a Sub Lesson