Maryland Math 8.AT.D.10
Standard Cluster
Construct and interpret a linear function to model a relationship between two quantities. Given two input-output pairs, a graph, a table, or a description of a relationship, determine the rate of change and initial value and write the linear equation that models the situation. Interpret the rate of change and initial value in the context of the problem.
Maryland College and Career Ready Standards for Mathematics (2025) · MODEL WITH FUNCTIONS.
Cluster contents
Standards in This Cluster
8.AT.D.10 is a cluster heading. These are the individual standards under it.
Teacher's field guide
What This Cluster Means
What Students Need to Do
- Students find the rate of change and starting amount from two points, a table, a graph, or a word problem. They write a linear equation and explain what both numbers mean in the situation.
What Mastery Looks Like
- A ride costs $7 for 1 mile and $13 for 3 miles. A student writes C = 3m + 4, explains the $4 starting charge and $3 cost per mile, then checks both prices.
Common Misconceptions
- Students may divide an output by its input instead of comparing changes in both values. They may treat the first table entry as the starting amount, even when the input is not zero. On a graph, they may mistake the x-intercept for the starting amount.
How to Assess It
- Exit ticket: A bike rental costs $11 for 1 hour and $21 for 3 hours. Write a cost equation, then explain the hourly rate and starting charge.
Lesson moves
Ways to Teach It
Start with 3 counters, add 2 per round for four rounds, then plot (round, total) and write the equation.
Have students write two sentences explaining what 4 and 3 mean in C = 4 + 3m for a taxi trip.
Have pairs race to match cards showing (0, 4) and (2, 10), a graph through those points, and y = 3x + 4.
Show a bike rental sign reading '$6 fee plus $4 per hour'; students write a cost equation and calculate three hours.
Free download
Printable 8.AT.D.10 Worksheet
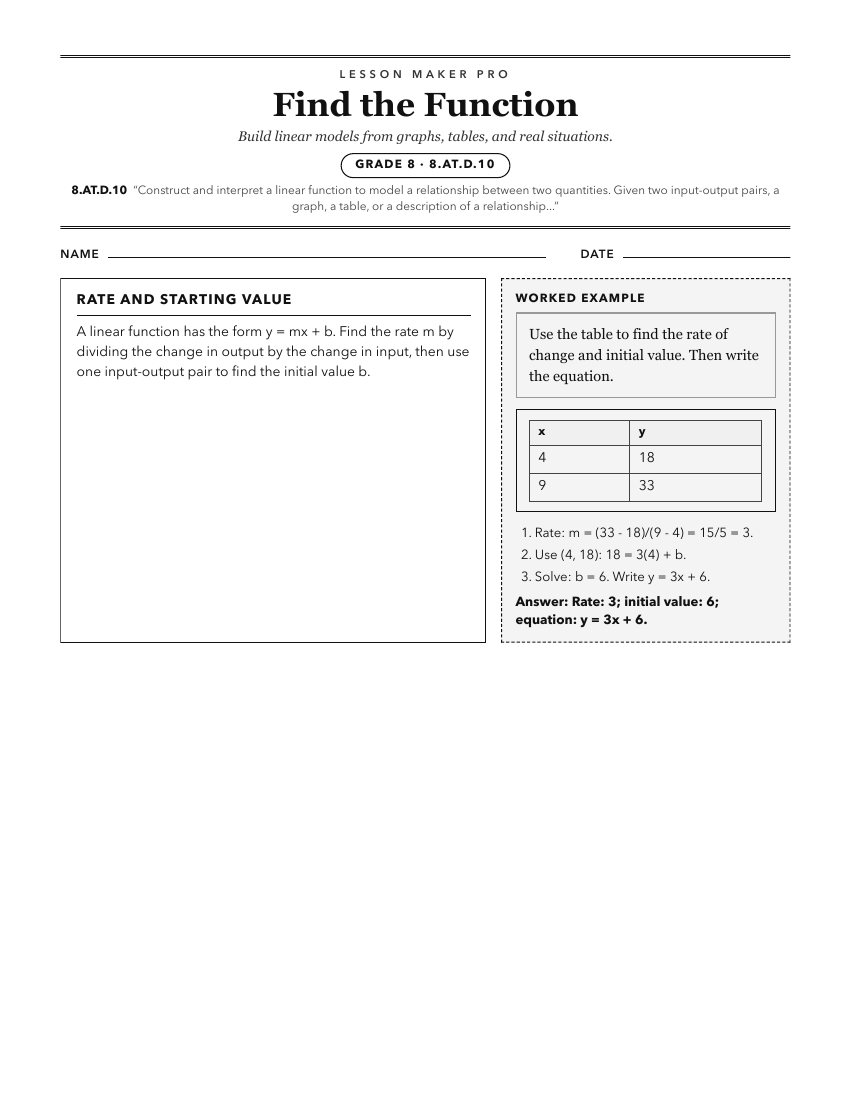
A ready-to-print activity worksheet aligned to 8.AT.D.10, with an answer key for the teacher on its own page. No account needed.
PDF, US Letter, prints cleanly in black and white.
Download the worksheetKeep exploring
Related Standards
- 7.AT.A.2
Identify proportional relationships between quantities.
- 5.AT.B.3.c
Use tables, ordered pairs, and graphs to represent the relationship between quantities.
- 8.DS.B.4
Use a provided linear model to make predictions based on bivariate measurement data. Interpret the meaning of the slope and y-intercept in context.
Turn this cluster into a lesson
Grade, subject, topic, and the complete cluster are prefilled. Create one free, no account needed.
Also for this cluster:Make a WorksheetMake a QuizMake a Sub Lesson