Maryland Math 7.DS.A.2
Standard Cluster
Use data from random samples to make and evaluate estimates or predictions about a population. Use data from a single random sample to estimate an unknown characteristic of a population. Generate and compare multiple random samples of the same size and use the variability across samples to assess how reliable an estimate or prediction is.
Maryland College and Career Ready Standards for Mathematics (2025) · MAKE SENSE OF STATISTICAL INQUIRY.
Cluster contents
Standards in This Cluster
7.DS.A.2 is a cluster heading. These are the individual standards under it.
Teacher's field guide
What This Cluster Means
What Students Need to Do
- Students use a random sample to estimate a count, percentage, or average for a larger group. They compare estimates from several samples of the same size to judge how dependable a prediction is.
What Mastery Looks Like
- If 6 of 20 randomly sampled students ride the bus, a student estimates about 60 bus riders in a school of 200. They know another random sample may give a different estimate and use the spread of estimates to judge how sure they can be.
Common Misconceptions
- Students may ask only their friends and call that a random sample. They may treat one sample estimate as the exact answer or assume all random samples must give the same result.
How to Assess It
- Exit ticket: A random sample of 20 from 200 students includes 6 bus riders. Estimate the total, then use estimates of 50, 60, and 80 from three other samples of 20 to judge how reliable your estimate is.
Lesson moves
Ways to Teach It
Put 80 red and blue tiles in a bag; pairs draw 10 blindly, estimate the bag's red share, return them, and repeat three times.
Write to the principal: Three random samples of 20 estimate bus ridership at 35%, 40%, and 65%; should one figure be trusted?
Play Estimate Showdown with 30 face-down playing cards: teams draw five, predict the deck's red count, replace, shuffle, and compare three estimates.
Use a numbered list of 100 mock cafeteria orders; generate 15 random row numbers, estimate vegetarian orders, then compare predictions across groups.
Free download
Printable 7.DS.A.2 Worksheet
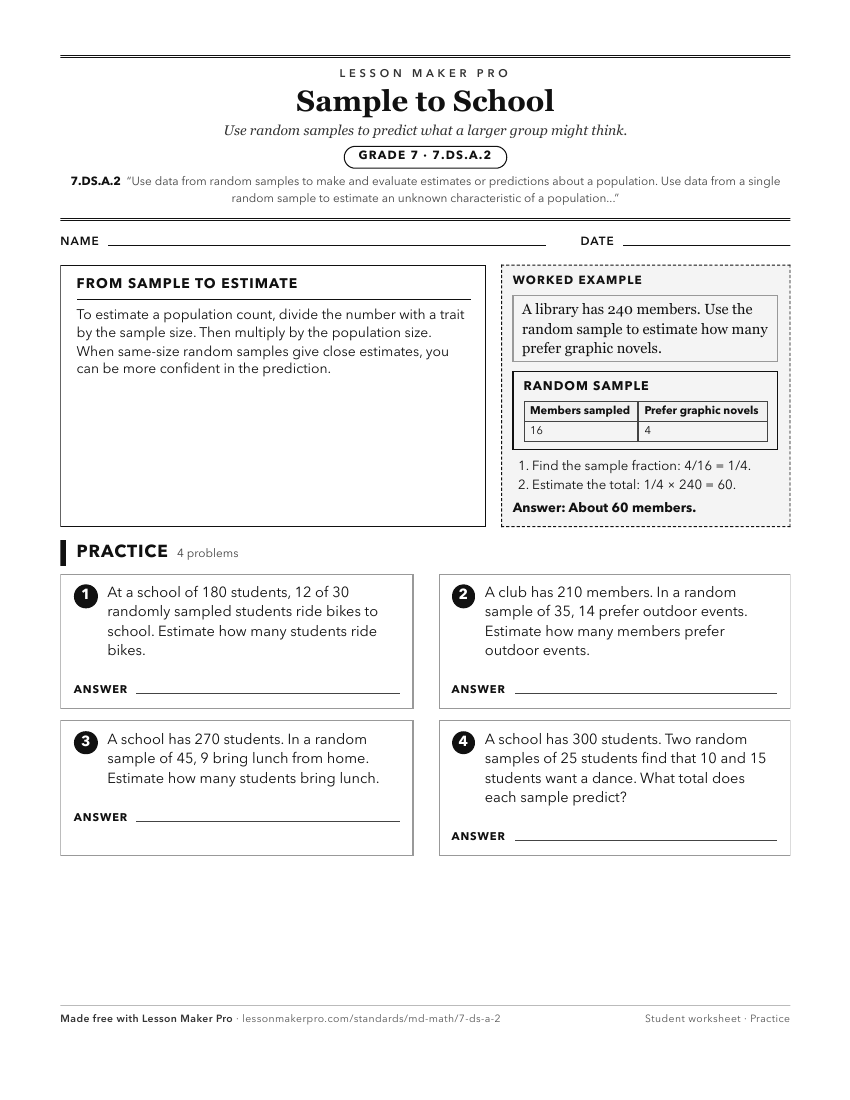
A ready-to-print activity worksheet aligned to 7.DS.A.2, with an answer key for the teacher on its own page. No account needed.
PDF, US Letter, prints cleanly in black and white.
Download the worksheetKeep exploring
Related Standards
Turn this cluster into a lesson
Grade, subject, topic, and the complete cluster are prefilled. Create one free, no account needed.
Also for this cluster:Make a WorksheetMake a QuizMake a Sub Lesson