Maryland Math 7.DS.A.2.a
The Standard
- 7.DS.A.2
- Use data from random samples to make and evaluate estimates or predictions about a population.
Use data from a single random sample to estimate an unknown characteristic of a population.
Maryland College and Career Ready Standards for Mathematics (2025) · MAKE SENSE OF STATISTICAL INQUIRY.
Teacher's field guide
What This Standard Means
What Students Need to Do
- Students use one random sample to estimate a proportion or average for a larger group. They use that result to estimate a population total when needed.
What Mastery Looks Like
- Given that 9 of 30 randomly selected students bring lunch, they estimate that 30% of the school brings lunch. At a school of 600, they estimate 180 students and say why that number might not be exact.
Common Misconceptions
- Students may treat the sample count as the count for the whole school. They may think the estimate is exact, or that asking their friends counts as a random sample.
How to Assess It
- Exit ticket: A school has 600 students. Nine of 30 randomly selected students bring lunch. Estimate how many students bring lunch, and explain why your answer might not be exact.
Lesson moves
Ways to Teach It
Put 100 red and blue counters in a bag; students draw 20 without looking, estimate the red share, then count all 100.
Ask: If 6 of 20 randomly chosen students walk to school, would asking only your friends give a trustworthy estimate? Why?
Match cards labeled '4 of 20, population 200,' '6 of 20, population 400,' and '8 of 20, population 600' to estimated counts.
Randomly pick 10 names from the class roster, ask who walks to school, and estimate the share of the class who walk.
Free download
Printable 7.DS.A.2.a Worksheet
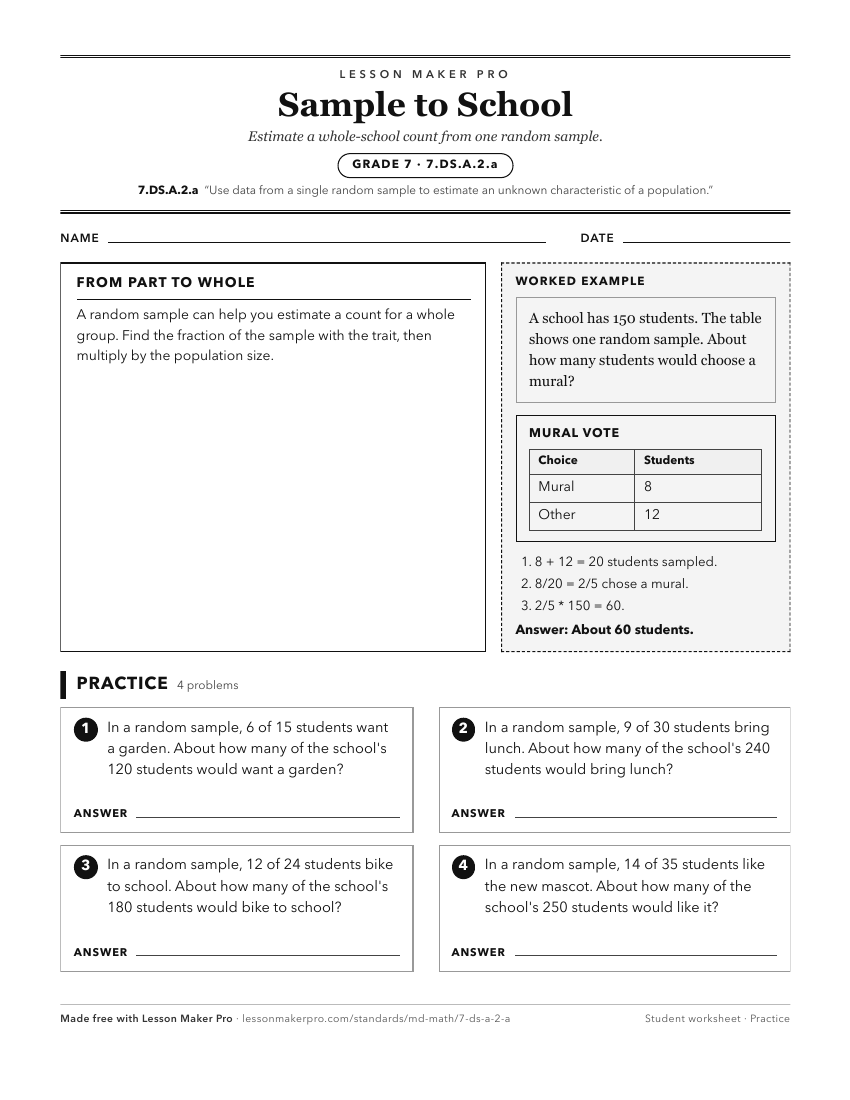
A ready-to-print activity worksheet aligned to 7.DS.A.2.a, with an answer key for the teacher on its own page. No account needed.
PDF, US Letter, prints cleanly in black and white.
Download the worksheetKeep exploring
Related Standards
- 7.DS.C.5.a
Use data collection or simulation to approximate the probability of a chance event by observing its long-run relative frequency.
- 7.DS.A.2
Use data from random samples to make and evaluate estimates or predictions about a population.
- 7.DS.A.1.b
Explain how a random sample increases the likelihood that the sample represents the population.
- 7.DS.A.2.b
Generate and compare multiple random samples of the same size and use the variability across samples to assess how reliable an estimate or prediction is.
Turn this exact standard into a lesson
Grade, subject, topic, and the complete standard are prefilled. Create one free, no account needed.
Also for this standard:Make a WorksheetMake a QuizMake a Sub Lesson