Maryland Math 6.AT.D.11
Standard Cluster
Use variables to represent two quantities in context that change in relationship to one another. Write an equation (one-step) to express one quantity, thought of as the dependent variable, in terms of the other quantity, thought of as the independent variable. Analyze the relationship between the dependent and independent variables using graphs and tables, and relate these to the equation (e.g., in a problem involving motion at constant speed, list and graph ordered pairs of distances and times and write the equation d = 65𝑡 to represent the relationship between distance and time).
Maryland College and Career Ready Standards for Mathematics (2025) · REPRESENT AND ANALYZE QUANTITATIVE RELATIONSHIPS BETWEEN DEPENDENT AND INDEPENDENT VARIABLES
Cluster contents
Standards in This Cluster
6.AT.D.11 is a cluster heading. These are the individual standards under it.
- 6.AT.D.11.a
Write an equation (one-step) to express one quantity, thought of as the dependent variable, in terms of the other quantity, thought of as the independent variab...
- 6.AT.D.11.b
Analyze the relationship between the dependent and independent variables using graphs and tables, and relate these to the equation (e.g., in a problem involving...
Teacher's field guide
What This Cluster Means
What Students Need to Do
- Students choose a letter for each changing quantity and decide which one depends on the other. They write a one-step equation, make a table of pairs, and graph the pairs on labeled axes.
What Mastery Looks Like
- Given tickets that cost $3 each, a student writes c = 3t, with t for tickets and c for total cost. They make matching table values and plot (0, 0), (1, 3), and (2, 6). They put tickets on the horizontal axis.
Common Misconceptions
- Students may write t = 3c even though cost depends on the number of tickets. They may reverse the ordered pairs or leave the axes unlabeled. Some write c = t + 3 instead of c = 3t.
How to Assess It
- Exit ticket: A printer makes 5 pages per minute, with m for minutes and p for pages. Name the dependent quantity, write an equation, complete a table for 0, 1, and 3 minutes, and plot those pairs on labeled axes.
Lesson moves
Ways to Teach It
Put three counters in each cup, then record cup and counter counts in a table, graph the pairs, and write an equation.
Ask students to explain why time goes on the horizontal axis for a bike traveling 6 miles each hour.
Give pairs cards with tables, graphs, and equations for 3 or 5 stickers per sheet, and have them sort matching sets.
Use a posted $2 per bus ride fare to graph total cost for zero to five rides and write C = 2r.
Free download
Printable 6.AT.D.11 Worksheet
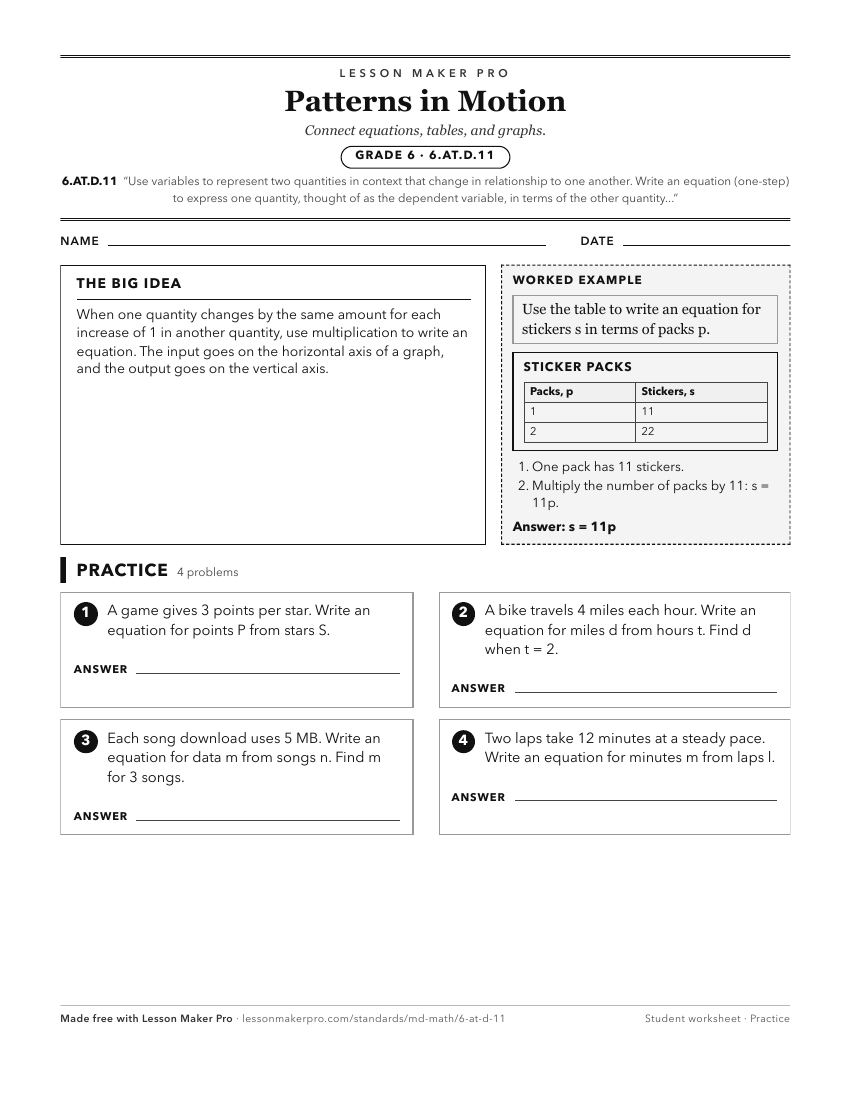
A ready-to-print activity worksheet aligned to 6.AT.D.11, with an answer key for the teacher on its own page. No account needed.
PDF, US Letter, prints cleanly in black and white.
Download the worksheetKeep exploring
Related Standards
- 7.AT.C.9
Use variables to represent quantities and write and solve inequalities to model and reason about constraints and conditions in context.
- 7.AT.C.8
Use variables to represent quantities and write and solve equations to model and reason about relationships in context.
- 8.AT.D.10
Construct and interpret a linear function to model a relationship between two quantities.
- 6.AT.C.8.a
Explain that a variable can represent an unknown number and use substitution to determine whether a given number makes an equation true.
Turn this cluster into a lesson
Grade, subject, topic, and the complete cluster are prefilled. Create one free, no account needed.
Also for this cluster:Make a WorksheetMake a QuizMake a Sub Lesson