Maryland Math 6.AT.D.11.b
The Standard
- 6.AT.D.11
- Use variables to represent two quantities in context that change in relationship to one another.
Analyze the relationship between the dependent and independent variables using graphs and tables, and relate these to the equation (e.g., in a problem involving motion at constant speed, list and graph ordered pairs of distances and times and write the equation d = 65𝑡 to represent the relationship between distance and time).
Maryland College and Career Ready Standards for Mathematics (2025) · REPRESENT AND ANALYZE QUANTITATIVE RELATIONSHIPS BETWEEN DEPENDENT AND INDEPENDENT VARIABLES
Teacher's field guide
What This Standard Means
What Students Need to Do
- Students decide which quantity depends on the other. They use a table, graph, and equation to show the same relationship and explain what each shows.
What Mastery Looks Like
- Given a table of time and distance, students name time as the input and distance as the output. They plot the pairs, find the speed, and write an equation that fits every row.
Common Misconceptions
- Students may put distance on the horizontal axis when time is the input. They may plot points correctly but use the wrong rate in their equation. For 5 miles each hour, some write d = t + 5 instead of d = 5t.
How to Assess It
- Exit ticket: Time in hours is 0, 1, 2, 3; distance in miles is 0, 4, 8, 12. Ask students to name the input, graph the pairs, write an equation, and explain what 4 means.
Lesson moves
Ways to Teach It
Add three counters to a cup each turn; record turns and totals, graph the pairs, and write an equation.
Show a time-distance graph with points (0,0), (1,5), and (2,10); ask why time goes on the horizontal axis.
Hand out table, graph, and equation cards for three different rates; have students match each set and explain one match.
Use a $4-per-hour bike rental sign; have students list costs for 0 to 3 hours, graph them, and write c = 4h.
Free download
Printable 6.AT.D.11.b Worksheet
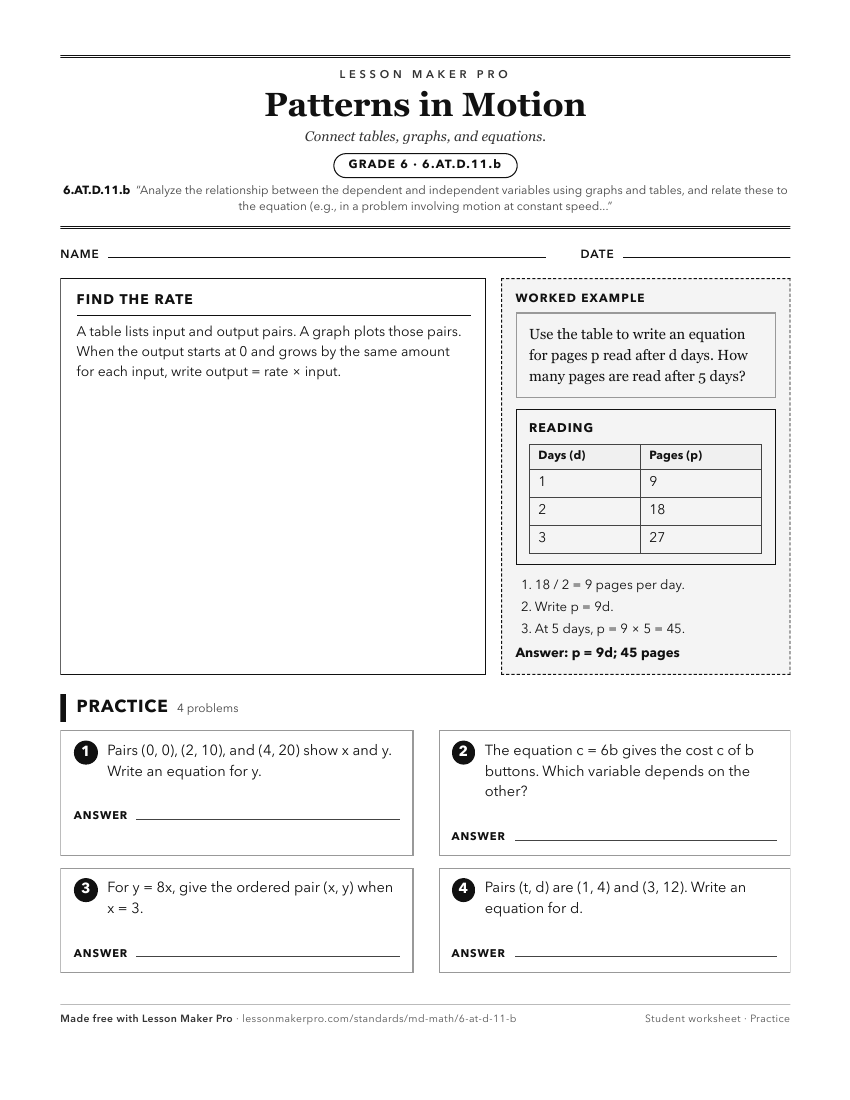
A ready-to-print activity worksheet aligned to 6.AT.D.11.b, with an answer key for the teacher on its own page. No account needed.
PDF, US Letter, prints cleanly in black and white.
Download the worksheetKeep exploring
Related Standards
- 8.AT.D.10.a
Given two input-output pairs, a graph, a table, or a description of a relationship, determine the rate of change and initial value and write the linear equation...
- 5.AT.B.3.c
Use tables, ordered pairs, and graphs to represent the relationship between quantities.
- 8.AT.A.1.b
Compare proportional relationships represented in different forms (e.g., graphs, equations, and tables) by analyzing their slopes.
- 6.AT.D.11.a
Write an equation (one-step) to express one quantity, thought of as the dependent variable, in terms of the other quantity, thought of as the independent variab...
Turn this exact standard into a lesson
Grade, subject, topic, and the complete standard are prefilled. Create one free, no account needed.
Also for this standard:Make a WorksheetMake a QuizMake a Sub Lesson