Indiana Social Studies WG.4.1
The Standard
Using maps, establish world patterns of population distribution, density, and growth. Relate population growth rates to health statistics, food supply, or measure of well-being. Explain that population patterns differ not only among countries but also among regions within a single country.
2026 Indiana Academic Standards: K-12 Social Studies · Characteristics, Distribution, and Migration of Human Populations
Teacher's field guide
What This Standard Means
What Students Need to Do
- Students use maps to locate population clusters and compare density and growth rates around the world. They check growth rates against life expectancy or food supply figures. They compare regions within one country rather than treating it as uniform.
What Mastery Looks Like
- A student reads map keys correctly and distinguishes total population from population density. They compare growth rates and life expectancy figures without claiming one causes the other. They identify two regions in the same country with different population patterns.
Common Misconceptions
- Students may mistake a large total population for high density or read a growth rate as the number of people added. They may assume every region in a country has the same pattern. They may also treat a link between growth and life expectancy as proof of cause.
How to Assess It
- Hand out world density and growth maps, a life expectancy table, and an India state density map. Ask: "Where are people clustered, how do growth and life expectancy compare in two countries, and which two Indian states differ in density?"
Lesson moves
Ways to Teach It
Place tracing paper over printed world density and growth maps; shade one high-density area and one fast-growing area, then compare their overlap.
Using a two-country growth and life expectancy table, write what the numbers show and one question the table cannot answer.
Give pairs four country cards with density, growth rate, and population; have them sort by each measure and defend one surprising rank.
Use a county census tract density map to choose a site for a new bus stop; explain why tract density matters more than the county average.
Free download
Printable WG.4.1 Worksheet
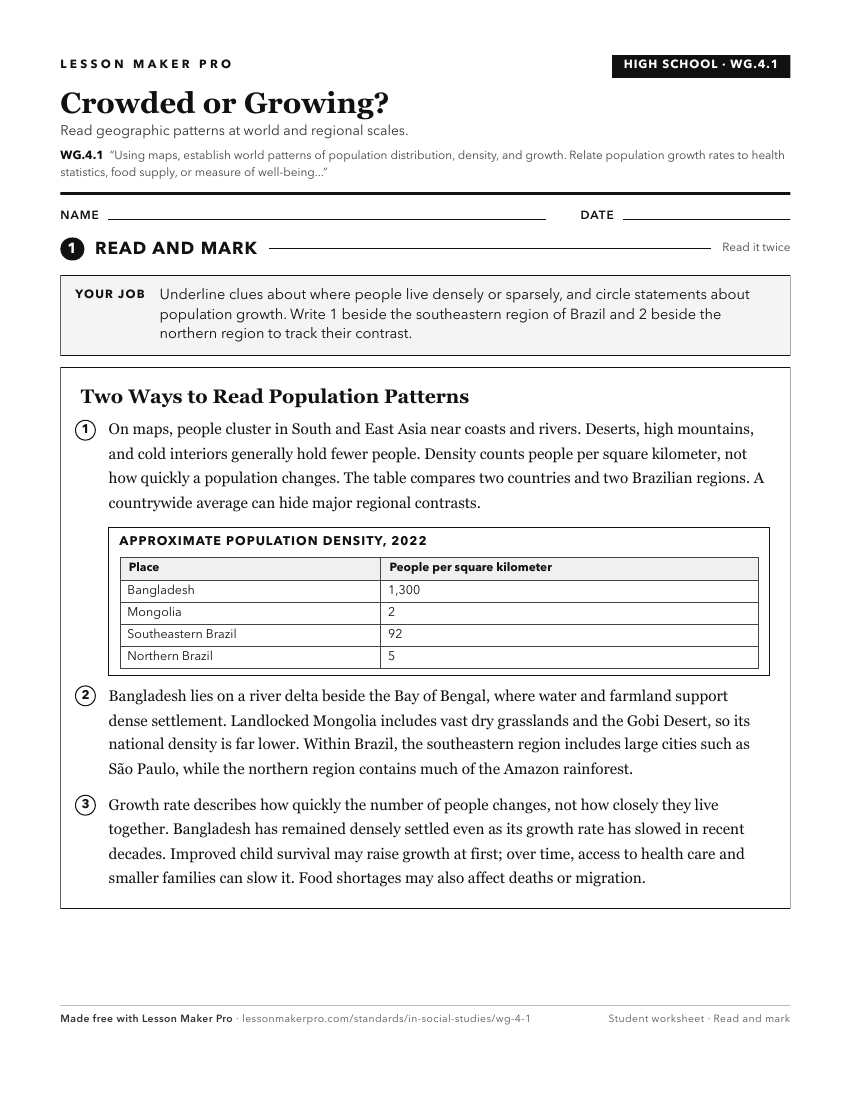
A ready-to-print activity worksheet aligned to WG.4.1, with an answer key for the teacher on its own page. No account needed.
PDF, US Letter, prints cleanly in black and white.
Download the worksheetKeep exploring
Related Standards
- 7.G.7
Identify current trends and patterns of rural and urban population distribution in selected countries of Africa, Asia, and the Southwest Pacific, and analyze th...
- GHW.3.1
Map and analyze the distribution of the world's human population for different time periods, noting the population characteristics and population density for sp...
- WG.4.5
Assess the changes and consequences of population growth or decline in various parts of the United States based on global migration patterns and determine wheth...
- GHW.3.4
Give examples of and evaluate how the physical and human environments in different regions have changed over time due to significant population growth or declin...
Turn this exact standard into a lesson
Grade, subject, topic, and the complete standard are prefilled. Create one free, no account needed.
Also for this standard:Make a WorksheetMake a QuizMake a Sub Lesson