Indiana Social Studies GHW.3.1
The Standard
Map and analyze the distribution of the world’s human population for different time periods, noting the population characteristics and population density for specific regions.
2026 Indiana Academic Standards: K-12 Social Studies
Teacher's field guide
What This Standard Means
What Students Need to Do
- Students use maps and data from different years to show where people live. They calculate people per square kilometer for named regions and compare traits such as urban share or age mix.
What Mastery Looks Like
- A student maps population density in Africa, Asia, and Europe for 1950 and 2020. They explain which regions grew denser and use an urban-share or age figure to describe another change.
Common Misconceptions
- Students may treat a large population as proof of high density without considering land area. They may use a modern map to describe 1950 or confuse urban share with density.
How to Assess It
- Exit ticket: On two blank maps, label Africa's 1950 and 2020 densities using populations of 230 million and 1.34 billion and an area of 30 million square kilometers. State how its urban share changed from 14% to 44%.
Lesson moves
Ways to Teach It
Give students maps and 1950 and 2020 regional population, area, and urban-share tables; have them calculate density and shade regions.
Ask: How did South Asia's density and urban share change from 1950 to 2020? Support your claim with two numbers from the maps and table.
Play a card match: pair regional population and area cards, calculate people per square kilometer, then rank the regions by density.
Compare 2010 and 2020 census tract density and age maps for your city, then choose a site for a new clinic and explain why.
Free download
Printable GHW.3.1 Worksheet
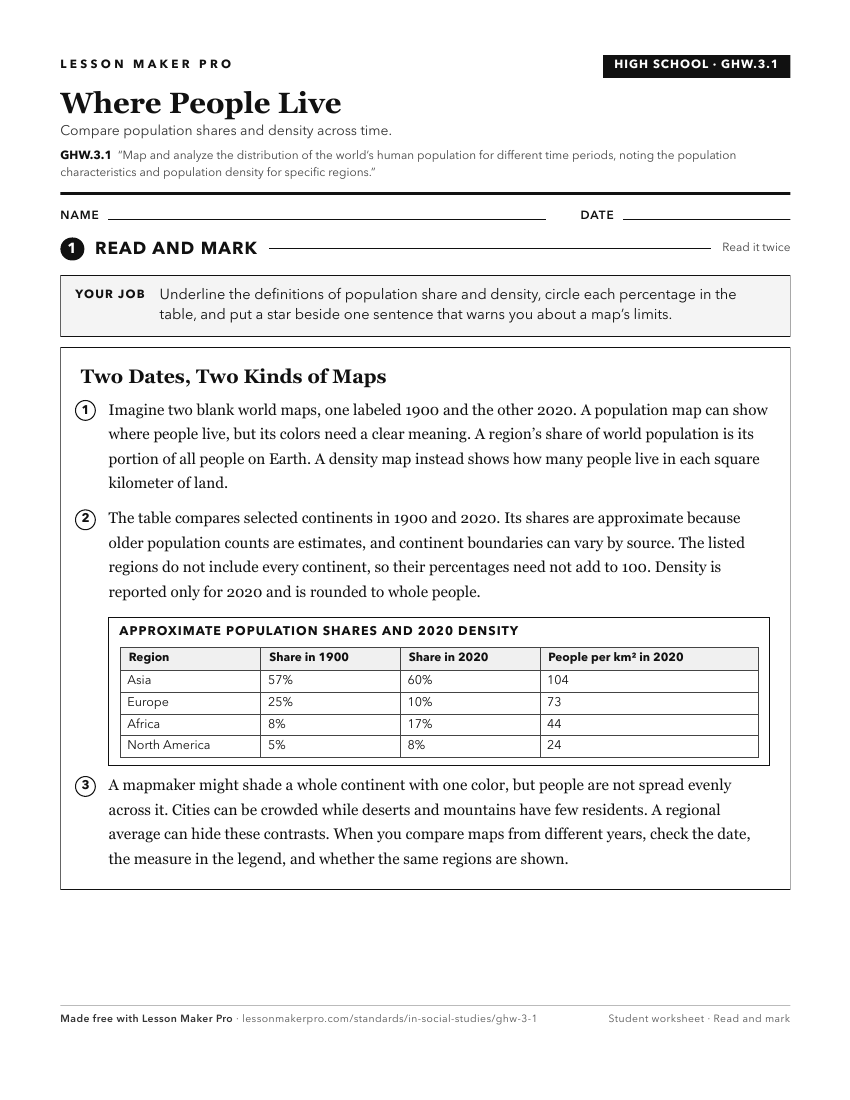
A ready-to-print activity worksheet aligned to GHW.3.1, with an answer key for the teacher on its own page. No account needed.
PDF, US Letter, prints cleanly in black and white.
Download the worksheetKeep exploring
Related Standards
- WG.4.6
Map the distribution patterns and concentration areas of the world’s major religions and identify cultural features and population centers associated with each.
- GHW.3.3
Analyze the changes in population characteristics and physical and human environments that resulted from the migration of peoples within, between, and among wor...
- WG.4.2
Develop maps of human migration and settlement patterns at different times in history and compare them to the present.
- WG.4.1
Using maps, establish world patterns of population distribution, density, and growth. Relate population growth rates to health statistics, food supply, or measu...
Turn this exact standard into a lesson
Grade, subject, topic, and the complete standard are prefilled. Create one free, no account needed.
Also for this standard:Make a WorksheetMake a QuizMake a Sub Lesson