Georgia S7L5.a
The Standard
- S7L5
- Obtain, evaluate, and communicate information from multiple sources to explain the theory of evolution of living organisms through inherited characteristics.
Use mathematical representations to evaluate explanations of how natural selection leads to changes in specific traits of populations over successive generations.
Georgia Standards of Excellence for Science · Obtain, evaluate, and communicate information from multiple sources to explain the theory of evolution of living organisms through inherited characteristics.
Teacher's field guide
What This Standard Means
What Students Need to Do
- Students calculate and compare the frequency or percentage of a trait in a population across several generations. They use tables, graphs, and ratios to identify changes. They then decide which explanation is best supported by the data.
What Mastery Looks Like
- Given survival and reproduction data, students correctly calculate trait frequencies and graph the pattern. They explain that individuals with an advantageous inherited trait leave more offspring. They cite numerical evidence instead of saying organisms changed because they needed to.
Common Misconceptions
- Students may say individual organisms evolve or gain a helpful trait during life. They may assume the most common trait is always advantageous or that natural selection creates needed mutations. Some compare raw counts without checking population size, which can hide changes in frequency.
How to Assess It
- Exit ticket: Green beetles leave more offspring on leafy plants. In generation 1, 20 of 100 are green. In generation 4, 54 of 90 are green. Calculate both percentages and explain the change using the data.
Lesson moves
Ways to Teach It
Scatter two colors of paper dots on patterned fabric, remove visible dots, double the survivors, and graph color percentages for four rounds.
Ask students to write: Which claim about the beetle population fits the graph, and what two numbers support your choice?
Play Trait Frequency Relay: teams calculate percentages from generation cards, plot points on a class graph, and match each pattern to an explanation.
Use a pesticide resistance table from five seasons to calculate resistant insect percentages and advise a farmer whether one pesticide remains effective.
Free download
Printable S7L5.a Worksheet
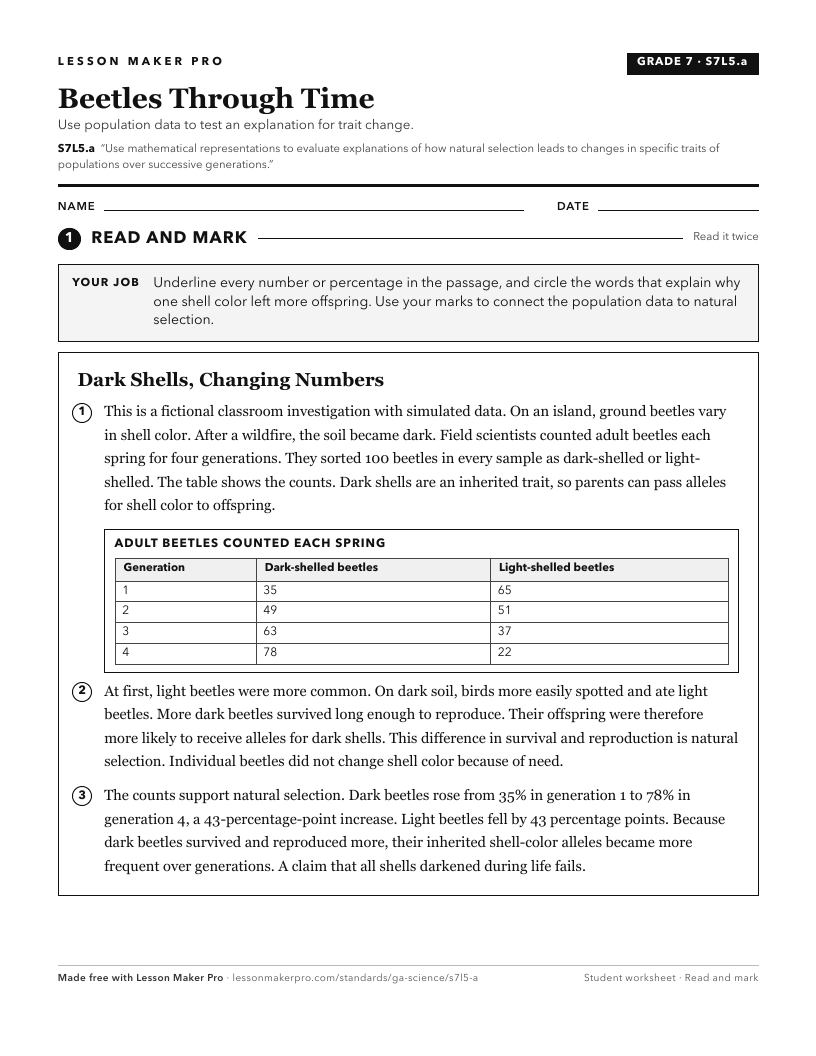
A ready-to-print activity worksheet aligned to S7L5.a, with an answer key for the teacher on its own page. No account needed.
PDF, US Letter, prints cleanly in black and white.
Download the worksheetKeep exploring
Related Standards
- S7L5
Obtain, evaluate, and communicate information from multiple sources to explain the theory of evolution of living organisms through inherited characteristics.
- S7L3.c
Ask questions to gather and synthesize information about the ways humans influence the inheritance of desired traits in organisms through selective breeding.
- S7L5.b
Construct an explanation based on evidence that describes how genetic variation and environmental factors influence the probability of survival and reproduction...
- S7L3.a
Construct an explanation supported with scientific evidence of the role of genes and chromosomes in the process of inheriting a specific trait.
Turn this exact standard into a lesson
Grade, subject, topic, and the complete standard are prefilled. Create one free, no account needed.
Also for this standard:Make a WorksheetMake a QuizMake a Sub Lesson