Florida SC.6.P.12.1
The Standard
Measure and graph distance versus time for an object moving at a constant speed. Interpret this relationship.
Florida Next Generation Sunshine State Standards for Science
Teacher's field guide
What This Standard Means
What Students Need to Do
- Students record an object’s distance from a starting point at equal time intervals. They plot time on the horizontal axis and distance on the vertical axis, then explain the pattern and rate.
What Mastery Looks Like
- Students create a labeled graph with accurately plotted points that form a straight, rising pattern. They use the graph to find distances at given times and explain that equal time intervals produce equal distance changes.
Common Misconceptions
- Students may switch the graph axes or record each interval’s distance instead of total distance from the start. They may think a steeper line means more time has passed rather than a faster speed.
How to Assess It
- Give students the data 0 seconds and 0 meters, 2 seconds and 4 meters, 4 seconds and 8 meters, 6 seconds and 12 meters. Ask them to graph it and predict the distance at 10 seconds.
Lesson moves
Ways to Teach It
Run a battery-powered toy car beside a meter tape, marking its distance every second, then graph the class data.
Show two distance-time graphs and ask students to write which object moves faster and cite evidence from the lines.
Give pairs cards showing tables, graphs, and speed descriptions, then have them race to make matching sets.
Graph a moving walkway traveling 12 meters every 10 seconds, then predict how far a rider travels in one minute.
Free download
Printable SC.6.P.12.1 Worksheet
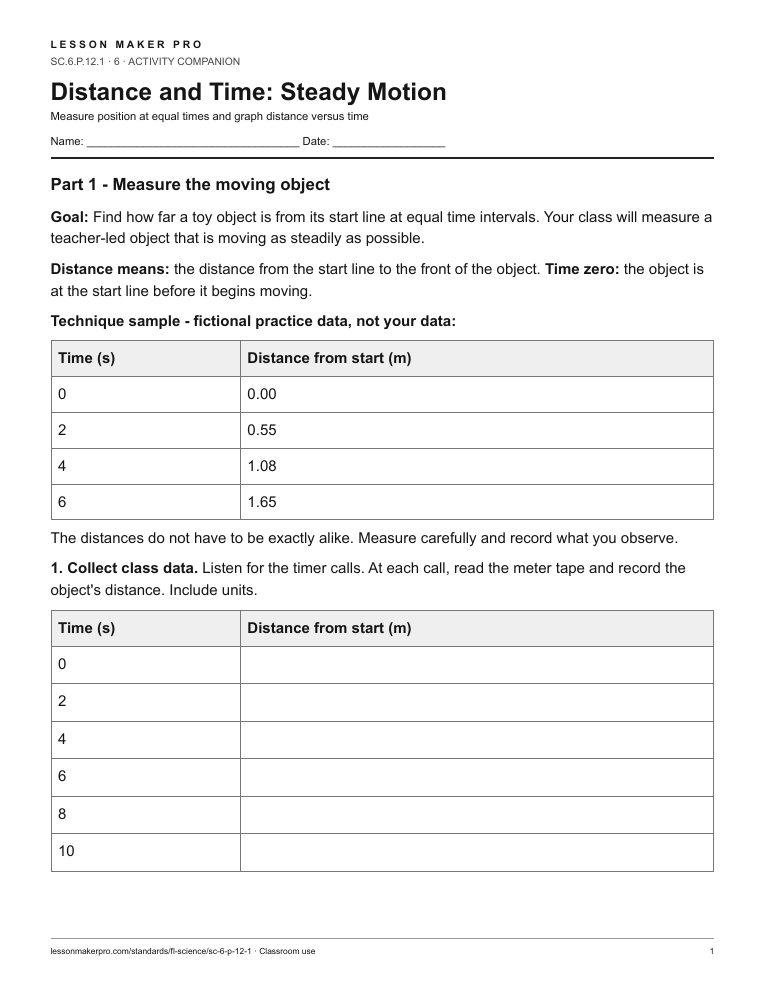
A ready-to-print activity worksheet aligned to SC.6.P.12.1, with an answer key for the teacher on its own page. No account needed.
PDF, US Letter, prints cleanly in black and white.
Download the worksheetKeep exploring
Related Standards
- SC.4.P.12.1
Recognize that an object in motion always changes its position and may change its direction.
- SC.4.P.12.2
Investigate and describe that the speed of an object is determined by the distance it travels in a unit of time and that objects can move at different speeds.
- SC.8.E.5.1
Recognize that there are enormous distances between objects in space and apply our knowledge of light and space travel to understand this distance.
- SC.1.P.12.1
Demonstrate and describe the various ways that objects can move, such as in a straight line, zigzag, back-and-forth, round-and-round, fast, and slow.
Turn this exact standard into a lesson
Grade, subject, topic, and the complete standard are prefilled. Create one free, no account needed.
Also for this standard:Make a WorksheetMake a QuizMake a Sub Lesson