CCSS.
Standard Cluster
Understand the connections between proportional relationships, lines, and linear equations.
Common Core State Standards for Mathematics
Cluster contents
Standards in This Cluster
CCSS.Math.Content.8.EE.B is a cluster heading. These are the individual standards under it.
- CCSS.Math.Content.8.EE.B.5
Graph proportional relationships, interpreting the unit rate as the slope of the graph. Compare two different proportional relationships represented in differen...
- CCSS.Math.Content.8.EE.B.6
Use similar triangles to explain why the slope m is the same between any two distinct points on a non-vertical line in the coordinate plane; derive the equation...
Teacher's field guide
What This Cluster Means
What Students Need to Do
- Students match tables, graphs, and equations that describe the same linear situation. They identify slope as a unit rate and explain how m and b shape a line.
What Mastery Looks Like
- A student calculates slope from two points, a table, or a graph and writes y = mx + b. They compare two linear relationships and justify which has the greater rate of change.
Common Misconceptions
- Students may confuse slope with the y-intercept, reverse rise and run, or assume every line passes through the origin. They may treat additive change as proportional and compare graphs by steepness without checking axis scales.
How to Assess It
- Give students the points (2, 5) and (6, 13). Ask them to find the slope, write the line’s equation, and explain whether the relationship is proportional.
Lesson moves
Ways to Teach It
Tape coordinate axes on the floor; students place point cards, measure rise and run, then write the matching equation.
Ask, “Can two lines have the same slope but different equations?” Students sketch examples and explain the role of the y-intercept.
Run a matching-card race with sets of tables, graphs, equations, slopes, and verbal situations that represent the same line.
Compare two taxi plans using posted fees and per-mile rates; students write equations and decide which plan costs less at given distances.
Free download
Printable 8.EE.B Worksheet
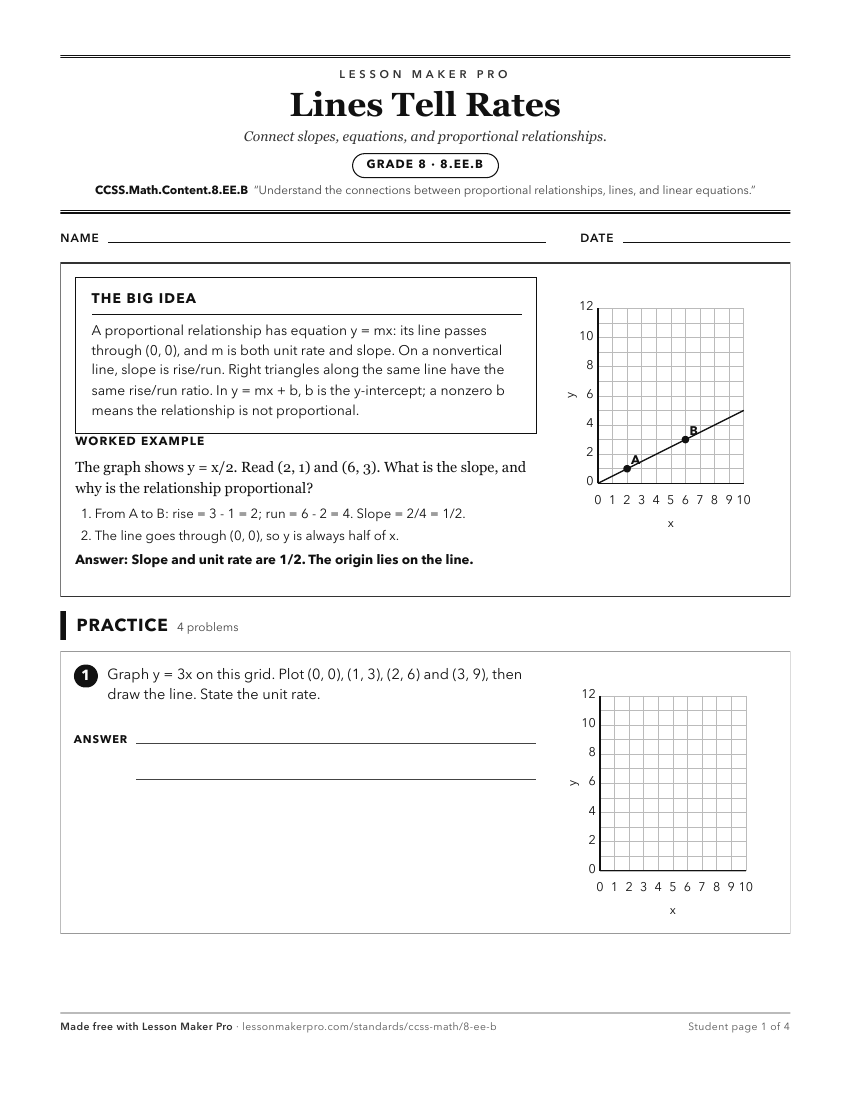
A ready-to-print activity worksheet aligned to CCSS.Math.Content.8.EE.B, with an answer key for the teacher on its own page. No account needed.
PDF, US Letter, prints cleanly in black and white.
Download the worksheetKeep exploring
Related Standards
- CCSS.Math.Content.7.RP.A.2
Recognize and represent proportional relationships between quantities.
- CCSS.Math.Content.7.RP.A
Analyze proportional relationships and use them to solve real-world and mathematical problems.
- CCSS.Math.Content.7.RP.A.2a
Decide whether two quantities are in a proportional relationship, e.g., by testing for equivalent ratios in a table or graphing on a coordinate plane and observ...
- CCSS.Math.Content.7.RP.A.2c
Represent proportional relationships by equations.
Turn this cluster into a lesson
Grade, subject, topic, and the complete cluster are prefilled. Create one free, no account needed.
Also for this cluster:Make a WorksheetMake a QuizMake a Sub Lesson