CCSS.
The Standard
Integrate quantitative or technical information expressed in words in a text with a version of that information expressed visually (e.g., in a flowchart, diagram, model, graph, or table).
Common Core State Standards for English Language Arts · Reading Standards for Literacy in Science and Technical Subjects 6—12
Teacher's field guide
What This Standard Means
What Students Need to Do
- Students match details in a science or technical passage to labels, steps, values, and patterns in a related visual. They combine evidence from both sources to explain a process, relationship, or result.
What Mastery Looks Like
- A student can match specific statements to data points, labels, or steps in a visual. The student uses both sources accurately and explains what each one adds.
Common Misconceptions
- Students may treat the visual as decoration or rely only on the paragraph. They may misread scales, keys, arrows, labels, or sequence. Some repeat information without explaining how the two sources connect.
How to Assess It
- Give students a short paragraph about rainfall and a related bar graph. Ask: "What conclusion can you draw by using one detail from each source?"
Lesson moves
Ways to Teach It
Give pairs cut-up statements from a science passage and matching graph labels, then have them pair and justify each match.
Ask students to write: "What does the diagram show more clearly than the paragraph, and what does the paragraph add?"
Run a matching relay where teams connect process descriptions to the correct stages in an unlabeled flowchart.
Compare a local weather report with its temperature graph, then identify one claim supported by both sources.
Free download
Printable RST.6-8.7 Worksheet
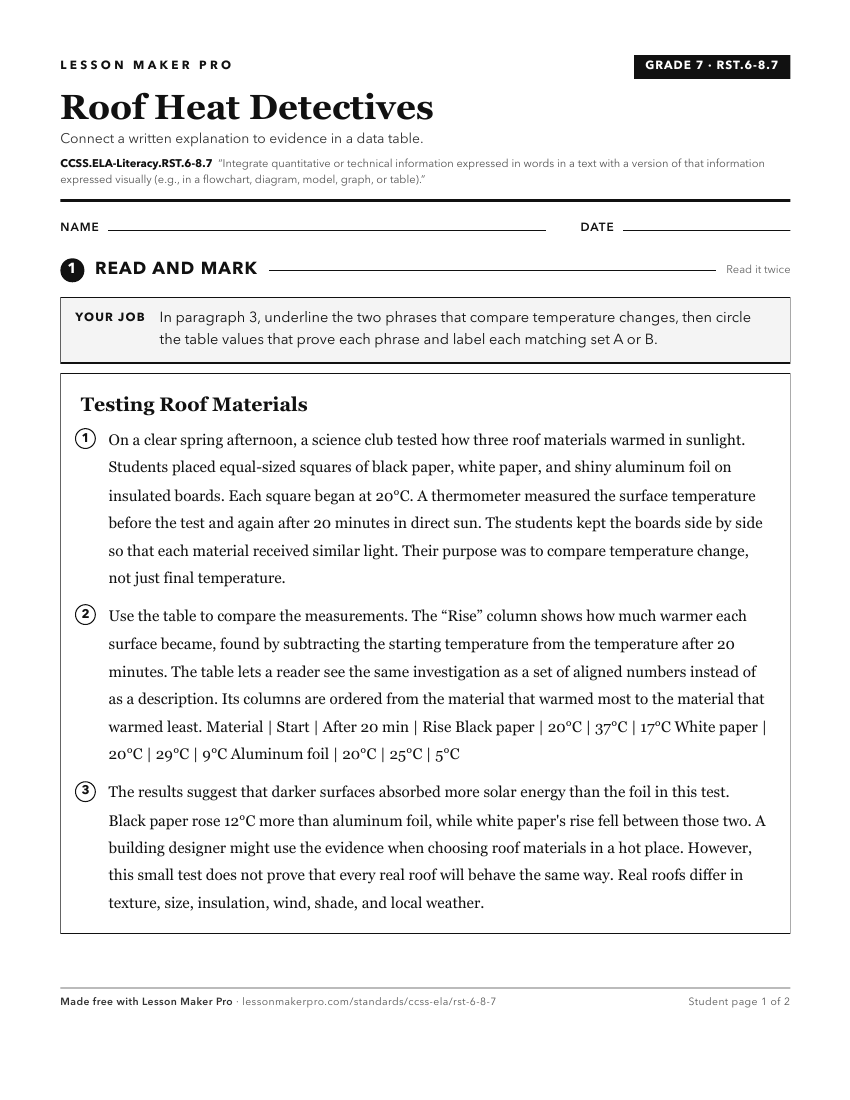
A ready-to-print activity worksheet aligned to CCSS.ELA-Literacy.RST.6-8.7, with an answer key for the teacher on its own page. No account needed.
PDF, US Letter, prints cleanly in black and white.
Download the worksheetKeep exploring
Related Standards
- CCSS.ELA-Literacy.RI.6.7
Integrate information presented in different media or formats (e.g., visually, quantitatively) as well as in words to develop a coherent understanding of a topi...
- CCSS.ELA-Literacy.RST.9-10.7
Translate quantitative or technical information expressed in words in a text into visual form (e.g., a table or chart) and translate information expressed visua...
- CCSS.ELA-Literacy.RH.6-8.7
Integrate visual information (e.g., in charts, graphs, photographs, videos, or maps) with other information in print and digital texts.
- CCSS.ELA-Literacy.RH.9-10.7
Integrate quantitative or technical analysis (e.g., charts, research data) with qualitative analysis in print or digital text.
Turn this exact standard into a lesson
Grade, subject, topic, and the complete standard are prefilled. Create one free, no account needed.
Also for this standard:Make a WorksheetMake a QuizMake a Sub Lesson