CCSS.
The Standard
Integrate visual information (e.g., in charts, graphs, photographs, videos, or maps) with other information in print and digital texts.
Common Core State Standards for English Language Arts · Reading Standards for Literacy in History/Social Studies 6—12
Teacher's field guide
What This Standard Means
What Students Need to Do
- Students read charts, maps, photographs, videos, or graphs alongside written history or social studies texts. They connect details across sources to build and support conclusions.
What Mastery Looks Like
- Students accurately read labels, legends, scales, captions, and data points. They explain how a visual confirms, adds to, or challenges information in the text, using evidence from both.
Common Misconceptions
- Students may treat the visual as decoration or summarize it without connecting it to the text. They may also misread map keys, graph scales, dates, captions, or camera perspective.
How to Assess It
- Give students a population density map and a short paragraph about migration. Ask them to state one conclusion and support it with one detail from each source.
Lesson moves
Ways to Teach It
Give pairs a map and article, then have them connect matching details with colored sticky notes and explain each match.
Ask students to write: What does the photograph reveal that the written account leaves out? Cite one detail from each.
Play Evidence Match by having teams pair graph cards with text claims, then defend or reject each match.
Compare a local news article with its map or chart, then identify what readers would misunderstand if the visual were removed.
Free download
Printable RH.6-8.7 Worksheet
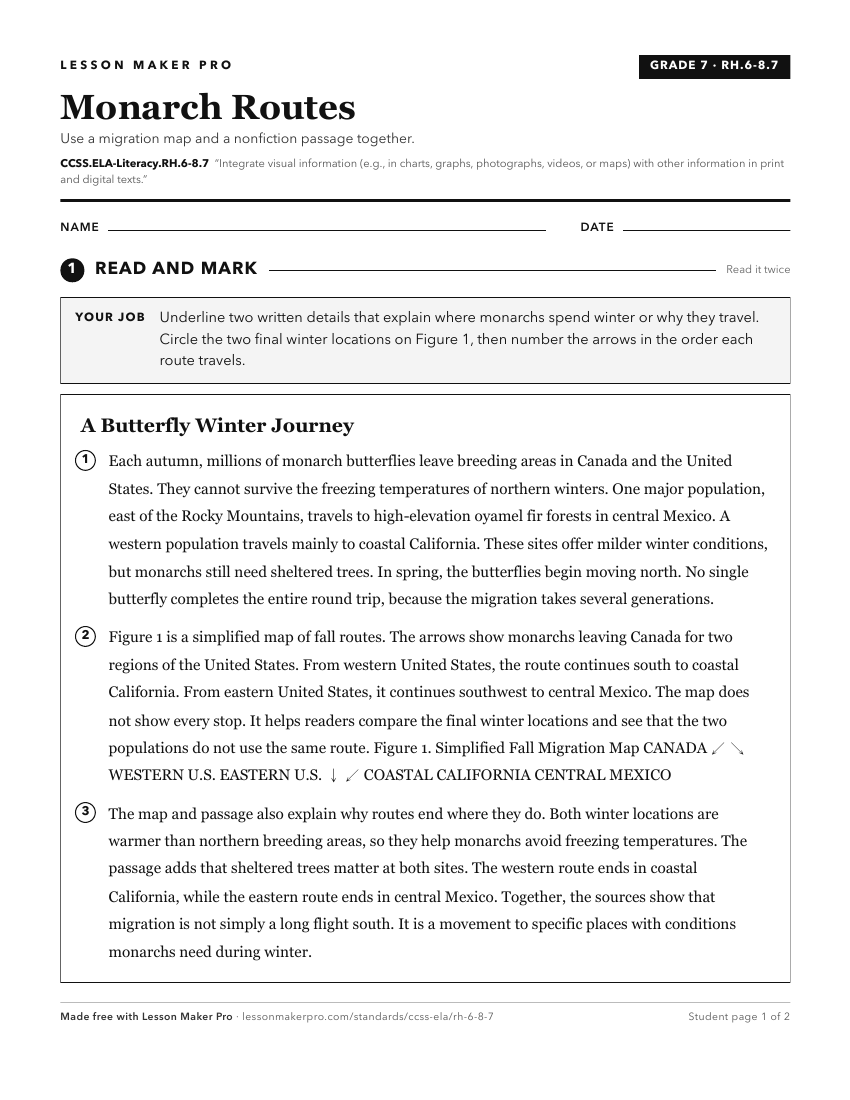
A ready-to-print activity worksheet aligned to CCSS.ELA-Literacy.RH.6-8.7, with an answer key for the teacher on its own page. No account needed.
PDF, US Letter, prints cleanly in black and white.
Download the worksheetKeep exploring
Related Standards
- CCSS.ELA-Literacy.RI.6.7
Integrate information presented in different media or formats (e.g., visually, quantitatively) as well as in words to develop a coherent understanding of a topi...
- CCSS.ELA-Literacy.RI.4.7
Interpret information presented visually, orally, or quantitatively (e.g., in charts, graphs, diagrams, time lines, animations, or interactive elements on Web p...
- CCSS.ELA-Literacy.RST.6-8.7
Integrate quantitative or technical information expressed in words in a text with a version of that information expressed visually (e.g., in a flowchart, diagra...
- CCSS.ELA-Literacy.CCRA.R.7
Integrate and evaluate content presented in diverse media and formats, including visually and quantitatively, as well as in words.
Turn this exact standard into a lesson
Grade, subject, topic, and the complete standard are prefilled. Create one free, no account needed.
Also for this standard:Make a WorksheetMake a QuizMake a Sub Lesson