CCSS.
The Standard
Translate quantitative or technical information expressed in words in a text into visual form (e.g., a table or chart) and translate information expressed visually or mathematically (e.g., in an equation) into words.
Common Core State Standards for English Language Arts · Reading Standards for Literacy in Science and Technical Subjects 6—12
Teacher's field guide
What This Standard Means
What Students Need to Do
- Students identify quantities, units, variables, and relationships in science or technical writing, then organize them in a useful visual. They also explain what a graph, table, diagram, or equation shows using accurate words.
What Mastery Looks Like
- Students choose a suitable table, chart, graph, or equation and label it correctly. They explain trends, rates, variables, and units in clear sentences without adding unsupported claims.
Common Misconceptions
- Students may copy every number without showing how the quantities relate. They may omit labels or units, confuse axes, or describe a graph point by point without naming the overall trend.
How to Assess It
- Exit ticket: “A tank contains 20 liters and loses 3 liters each minute.” Students make a labeled table for minutes 0 through 4, write an equation, and explain it in one sentence.
Lesson moves
Ways to Teach It
Give groups a printed heating log, then have them build a labeled line graph using sticky notes and string.
Display a graph and ask students to write three sentences explaining the trend, rate of change, and any unusual data point.
Create matching cards with short passages, tables, graphs, and equations, then have teams find and justify each matching set.
Use a phone data plan chart and ask students to explain the monthly cost pattern in words and an equation.
Free download
Printable RST.9-10.7 Worksheet
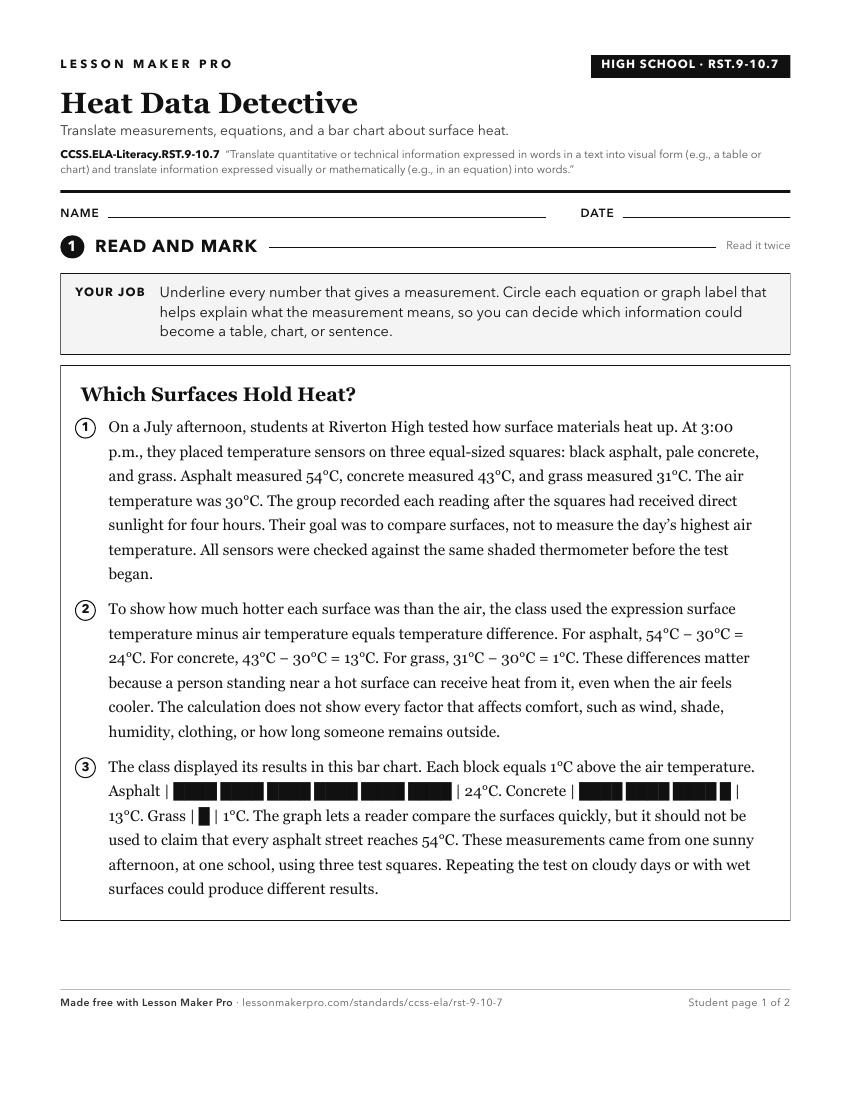
A ready-to-print activity worksheet aligned to CCSS.ELA-Literacy.RST.9-10.7, with an answer key for the teacher on its own page. No account needed.
PDF, US Letter, prints cleanly in black and white.
Download the worksheetLearning progression
Where This Standard Sits
See the whole path on the Reading: Science & Technical Subjects progression map.
What This Unlocks
Mastery here sets students up for these next.
Keep exploring
Related Standards
- CCSS.ELA-Literacy.RI.4.7
Interpret information presented visually, orally, or quantitatively (e.g., in charts, graphs, diagrams, time lines, animations, or interactive elements on Web p...
- CCSS.ELA-Literacy.RH.6-8.7
Integrate visual information (e.g., in charts, graphs, photographs, videos, or maps) with other information in print and digital texts.
- CCSS.ELA-Literacy.RST.6-8.7
Integrate quantitative or technical information expressed in words in a text with a version of that information expressed visually (e.g., in a flowchart, diagra...
- CCSS.ELA-Literacy.RH.9-10.7
Integrate quantitative or technical analysis (e.g., charts, research data) with qualitative analysis in print or digital text.
Turn this exact standard into a lesson
Grade, subject, topic, and the complete standard are prefilled. Create one free, no account needed.
Also for this standard:Make a WorksheetMake a QuizMake a Sub Lesson