Alabama Social Studies SS24.AS.3
The Standard
Describe the demographic characteristics of Alabama’s population, and explain how both historic and current migration patterns have shaped these characteristics.
2024 Alabama Course of Study: Social Studies
Teacher's field guide
What This Standard Means
What Students Need to Do
- Students use census charts and maps to describe Alabama's age groups, racial and ethnic makeup, and where people live. They trace how the forced removal of Native peoples, the forced movement of enslaved people into Alabama, and the Great Migration shaped the population. They connect recent moves to growing cities and immigration from other countries to current patterns.
What Mastery Looks Like
- A student can compare Alabama population data from two dates and point to changes in who lives where. They can use evidence to explain how one past movement and one recent movement contributed, without claiming migration explains every change.
Common Misconceptions
- Students may think the Great Migration brought Black families into Alabama rather than taking many out of the state. They may describe forced removal or slavery as voluntary movement. They may assume every population increase comes from immigration, overlooking births and moves within Alabama.
How to Assess It
- Give students Alabama race and ethnicity charts from 1920 and 2020 and a county growth map for 2000 to 2020. Ask them to cite two changes and link one to a historical migration and the other to a recent movement.
Lesson moves
Ways to Teach It
Give pairs 1920 and 2020 Alabama county population maps; have them mark changing population centers with stickers and draw possible migration arrows.
Ask: Why did many Black Alabamians leave during the Great Migration, and what population changes might follow their departure?
Play a card match: pair Native peoples' forced removal, the Great Migration, and recent immigration with their effects on Alabama's population.
Show a 2000 and 2020 Huntsville population chart; ask what school planners need to know before adding classrooms.
Free download
Printable SS24.AS.3 Worksheet
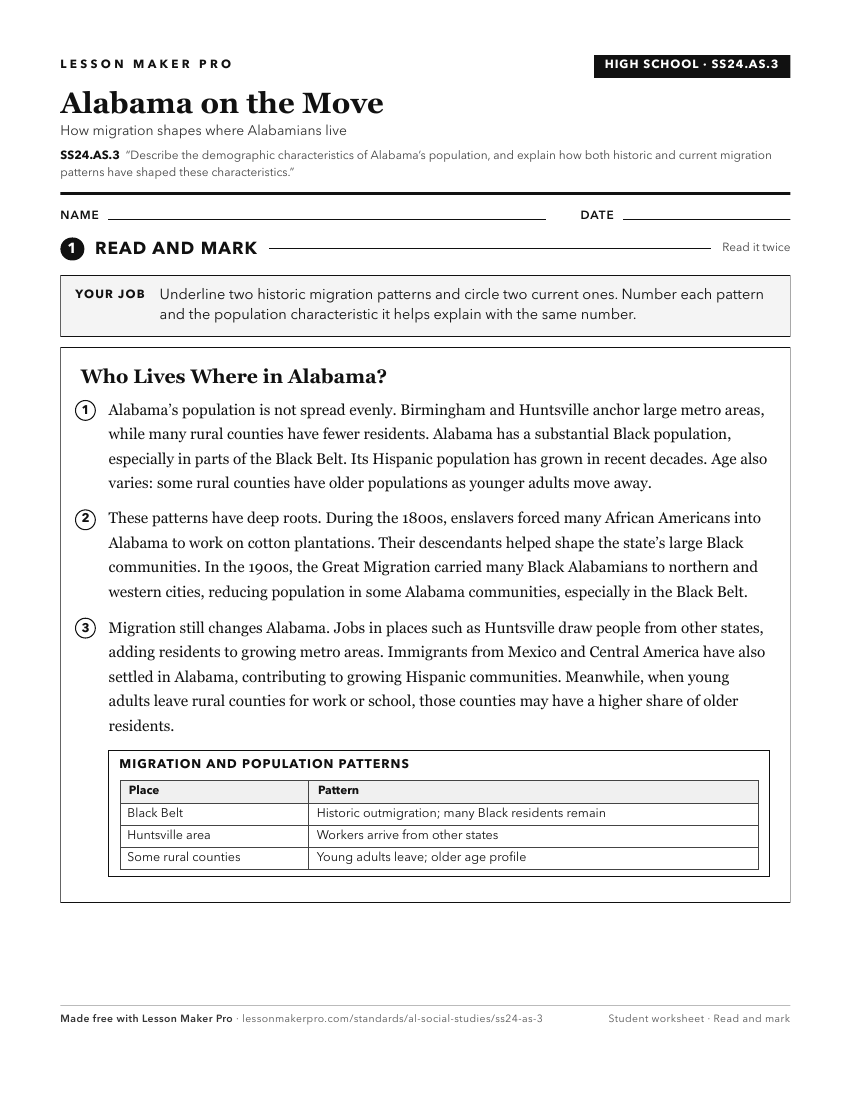
A ready-to-print activity worksheet aligned to SS24.AS.3, with an answer key for the teacher on its own page. No account needed.
PDF, US Letter, prints cleanly in black and white.
Download the worksheetKeep exploring
Related Standards
- SS24.3.3a
Locate state and national parks within Alabama and explain their historical and economic significance.
- SS24.5.4
Analyze the reasons for increased immigration to, and migration within, the United States and Alabama in the early twentieth century.
- SS24.AS.1
Identify the location of Alabama’s major geographic regions and describe the characteristics that distinguish them from each other.
- SS24.AS.21a
Describe ways in which Alabama’s geography contributes to the state’s present-day tourism industry.
Turn this exact standard into a lesson
Grade, subject, topic, and the complete standard are prefilled. Create one free, no account needed.
Also for this standard:Make a WorksheetMake a QuizMake a Sub Lesson