Alabama Science ES.11
Standard Cluster
Construct an explanation of how human populations undergo growth and decline. a. Analyze and interpret data on human population trends in developing and developed countries and in the global population as a whole. b. Construct explanations of the types of environmental impacts produced by human populations in each stage of the demographic transition model.
2023 Alabama Course of Study: Science · Earth and Human Activity
Cluster contents
Standards in This Cluster
ES.11 is a cluster heading. These are the individual standards under it.
Teacher's field guide
What This Cluster Means
What Students Need to Do
- Students read population graphs for a lower-income country, a higher-income country, and the world. They explain growth or decline using births, deaths, and migration. They connect each stage of population change to likely effects on land, water, waste, or energy use.
What Mastery Looks Like
- A student can explain why a population may keep growing after its birth rate falls. They use graph data to compare countries with the global trend. They name a plausible environmental impact at each stage and consider resource use per person, not just population size.
Common Misconceptions
- Students may think a falling birth rate means the population is shrinking, even when births still outnumber deaths. They may assume a shrinking population has little environmental impact, ignoring high resource use per person.
How to Assess It
- Exit ticket: Country A has 38 births and 9 deaths per 1,000 people; Country B has 8 births and 12 deaths. Predict each trend, name one likely environmental pressure in A, and explain how migration could change B’s trend.
Lesson moves
Ways to Teach It
Start with 100 beans, then add births and remove deaths over five rounds using rate cards; graph the changing population.
Show population graphs for Niger and Germany; ask students to write why a falling birth rate does not always mean population decline.
Give pairs four birth-and-death-rate cards; have them order the stages and match each card to a land, water, waste, or energy effect.
Show a town using 1 million gallons of water daily for 10,000 people, then 1.8 million for 12,000; calculate per-person use.
Free download
Printable ES.11 Worksheet
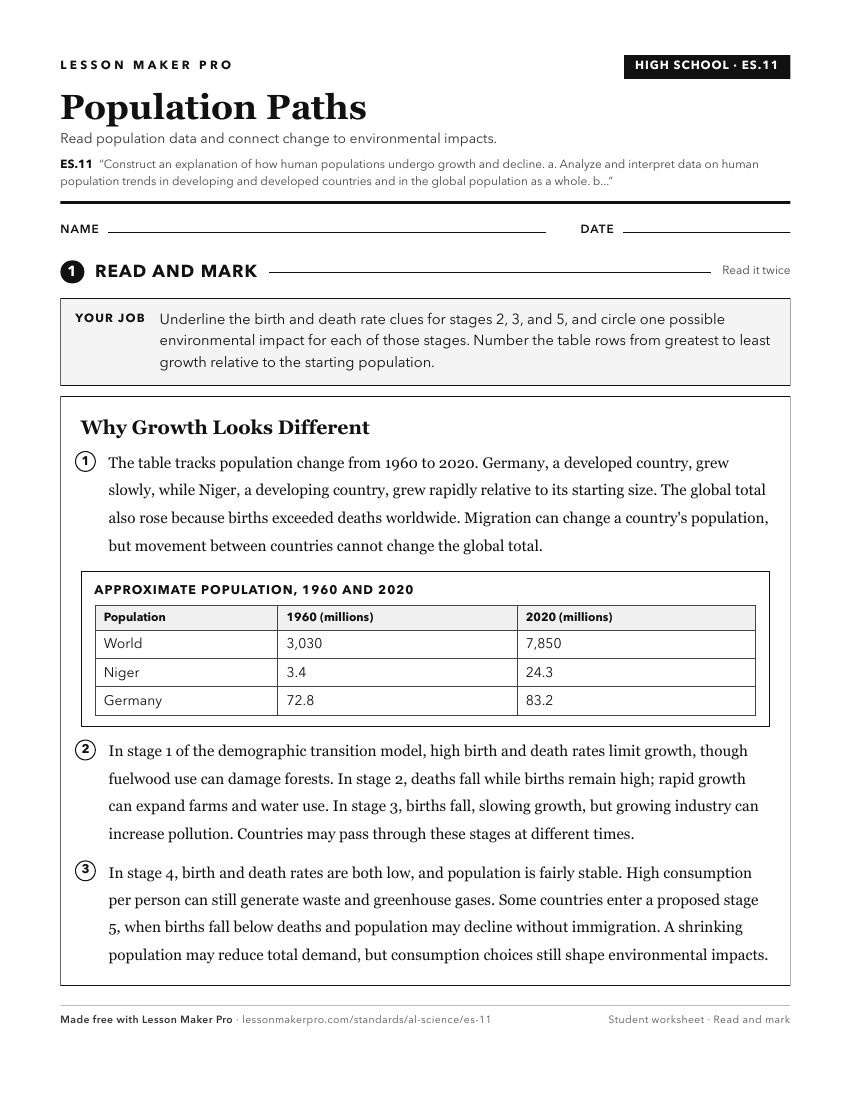
A ready-to-print activity worksheet aligned to ES.11, with an answer key for the teacher on its own page. No account needed.
PDF, US Letter, prints cleanly in black and white.
Download the worksheetKeep exploring
Related Standards
- BIO.8
Construct an evidence-based explanation of how density-dependent and density-independent factors affect population growth.
- ES.12
Obtain, evaluate, and communicate information to describe the effects of human population growth on global ecosystems.
- ES.3
Construct an explanation of how biotic and abiotic factors affect biodiversity and populations in ecosystems.
Turn this cluster into a lesson
Grade, subject, topic, and the complete cluster are prefilled. Create one free, no account needed.
Also for this cluster:Make a WorksheetMake a QuizMake a Sub Lesson