Alabama Math PC.F.A.25
Standard Cluster
- PC.F.A
- Interpret functions that arise in applications in terms of the context.
Calculate and interpret the average rate of change of a function (presented symbolically or as a table) over a specified interval. Estimate the rate of change from a graph. Extend from polynomial, exponential, logarithmic, and radical to rational and all trigonometric functions. a. Find the difference quotient (f(x+∆x)−f(x))/(∆x) of a function and use it to evaluate the average rate of change at a point. b. Explore how the average rate of change of a function over an interval (presented symbolically or as a table) can be used to approximate the instantaneous rate of change at a point as the interval decreases.
2019 Alabama Course of Study: Mathematics · Functions
Cluster contents
Standards in This Cluster
PC.F.A.25 is a cluster heading. These are the individual standards under it.
- PC.F.A.25.a
Find the difference quotient f(x + △x) - f(x)/△x of a function and use it to evaluate the average rate of change at a point.
- PC.F.A.25.b
Explore how the average rate of change of a function over an interval (presented symbolically or as a table) can be used to approximate the instantaneous rate o...
Teacher's field guide
What This Cluster Means
What Students Need to Do
- Students calculate average change per unit of input from a formula or table. They estimate rates from a graph and use smaller intervals to estimate the rate at one point.
What Mastery Looks Like
- A student calculates (f(a+h)-f(a))/h for several nonzero values of h and sees what happens as h gets smaller. They estimate a slope from a graph and explain the rate's sign and units in context.
Common Misconceptions
- Students may divide the change in output by the final input instead of the change in input. They may treat an average rate as the exact rate at a point, or set h=0 in the difference quotient.
How to Assess It
- Exit ticket: A tank holds f(t)=12/(t+1) liters after t hours. Calculate (f(1+h)-f(1))/h for h=1 and h=0.1, then estimate and explain the rate at t=1.
Lesson moves
Ways to Teach It
Print a graph of y=1/(x+1); students mark x=1, 2, and 1.2, then draw and compare two secant lines with rulers.
Ask: Why do slopes from x=0 to x=1 and from x=0 to x=0.1 differ on y=sin x, with x in radians?
Give pairs formula and rate cards for [1,2]; have them match x², 2^x, ln x, √x, 1/x, and sin x.
Print hourly temperatures from a weather app; students calculate degrees per hour from 8 to 10 and from 9 to 10.
Free download
Printable PC.F.A.25 Worksheet
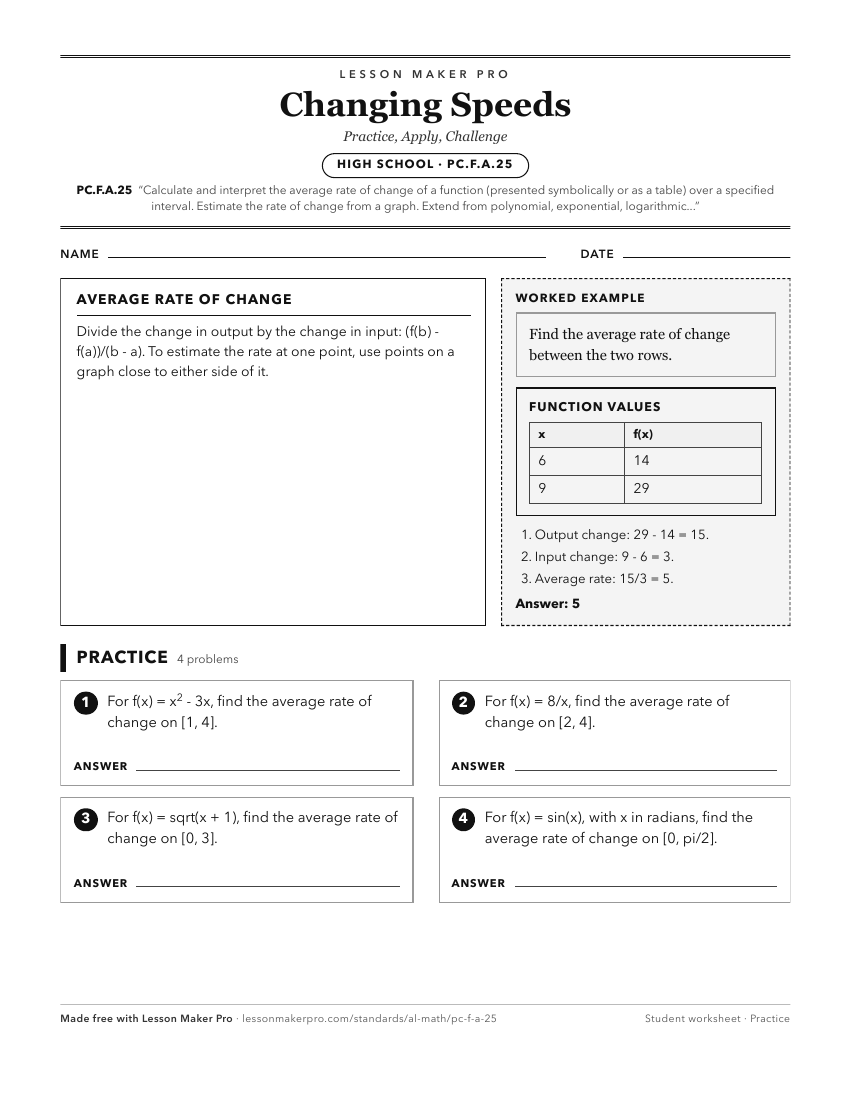
A ready-to-print activity worksheet aligned to PC.F.A.25, with an answer key for the teacher on its own page. No account needed.
PDF, US Letter, prints cleanly in black and white.
Download the worksheetKeep exploring
Related Standards
- A2S.AF.H.19
Calculate and interpret the average rate of change of a function (presented symbolically or as a table) over a specified interval. Estimate the rate of change f...
- 8A.AF.J.31
Calculate and interpret the average rate of change of a function (presented symbolically or as a table) over a specified interval. Estimate the rate of change f...
- A1P.AF.H.29
Calculate and interpret the average rate of change of a function (presented symbolically or as a table) over a specified interval. Estimate the rate of change f...
Turn this cluster into a lesson
Grade, subject, topic, and the complete cluster are prefilled. Create one free, no account needed.
Also for this cluster:Make a WorksheetMake a QuizMake a Sub Lesson