Alabama Math PC.F.A.25.a
The Standard
- PC.F.A
- Interpret functions that arise in applications in terms of the context.
- PC.F.A.25
- Calculate and interpret the average rate of change of a function (presented symbolically or as a table) over a specified interval. Estimate the rate of change from a graph. Extend from polynomial, exponential, logarithmic, and radical to rational and all trigonometric functions.
Find the difference quotient (f(x+∆x)−f(x))/(∆x) of a function and use it to evaluate the average rate of change at a point.
2019 Alabama Course of Study: Mathematics
Teacher's field guide
What This Standard Means
What Students Need to Do
- Students find f(x+h), subtract f(x), and divide by a nonzero h. They use the result to find the average rate of change from x to x+h.
What Mastery Looks Like
- For f(x)=x², a student simplifies the quotient to 2x+h. At x=3 and h=0.5, they get 6.5 and identify the interval as 3 to 3.5.
Common Misconceptions
- Students may treat f(x+h) as f(x)+f(h) or forget to subtract all of f(x). Some set h to zero or confuse an interval's average rate with a rate at one instant.
How to Assess It
- For s(t)=t² meters, simplify [s(t+h)−s(t)]/h. Find the average rate from 3 to 3.5 seconds and give its units.
Lesson moves
Ways to Teach It
Plot y=x² on graph paper, mark (2,4) and (3,9), draw a secant with a ruler, and calculate its slope.
Ask students to write why the average rates from x=2 to 3 and x=2 to 2.5 differ for f(x)=x².
Give pairs cards with f(x)=x², x=2, and h values of 1 or 2; have them match each to a quotient and rate.
Use s(t)=t² meters to calculate a toy car's average speed from 3 to 3.5 seconds, then label the answer in meters per second.
Free download
Printable PC.F.A.25.a Worksheet
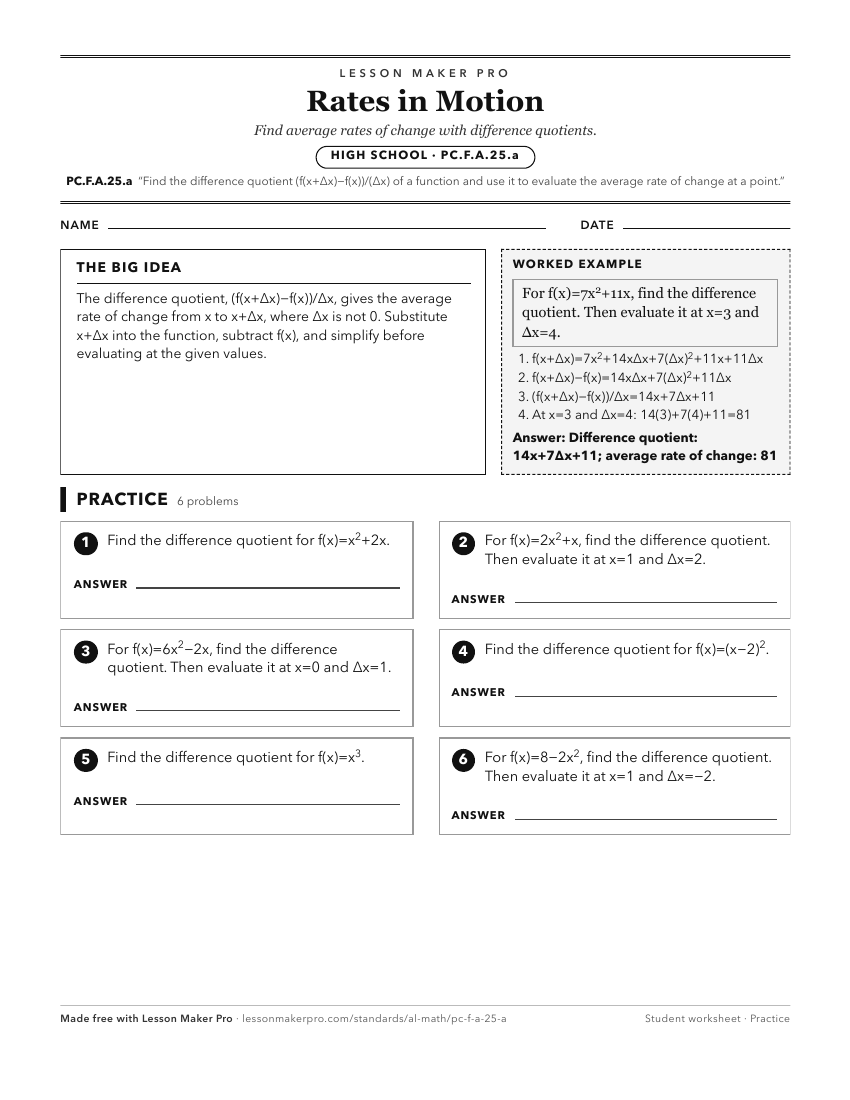
A ready-to-print activity worksheet aligned to PC.F.A.25.a, with an answer key for the teacher on its own page. No account needed.
PDF, US Letter, prints cleanly in black and white.
Download the worksheetKeep exploring
Related Standards
- A1P.AF.H.29
Calculate and interpret the average rate of change of a function (presented symbolically or as a table) over a specified interval. Estimate the rate of change f...
- 8A.AF.J.31
Calculate and interpret the average rate of change of a function (presented symbolically or as a table) over a specified interval. Estimate the rate of change f...
- A2S.AF.H.19
Calculate and interpret the average rate of change of a function (presented symbolically or as a table) over a specified interval. Estimate the rate of change f...
- PC.F.A.25.b
Explore how the average rate of change of a function over an interval (presented symbolically or as a table) can be used to approximate the instantaneous rate o...
Turn this exact standard into a lesson
Grade, subject, topic, and the complete standard are prefilled. Create one free, no account needed.
Also for this standard:Make a WorksheetMake a QuizMake a Sub Lesson