Alabama Math A1P.AF.H.29
The Standard
- A1P.AF.H
- Functions that are members of the same family have distinguishing attributes (structure) common to all functions within that family.
Calculate and interpret the average rate of change of a function (presented symbolically or as a table) over a specified interval. Estimate the rate of change from a graph. Limit to linear, quadratic, exponential, and absolute value functions.
2019 Alabama Course of Study: Mathematics
Teacher's field guide
What This Standard Means
What Students Need to Do
- Students find how much a function's output changes per unit of input across a given interval. They use a formula or table to calculate the rate, or a graph to estimate it. They explain what the rate means.
What Mastery Looks Like
- Students subtract the endpoint outputs and divide by the length of the input interval. They estimate the rate from two points on a graph and explain its sign and units. They know a curved graph can have different average rates on different intervals.
Common Misconceptions
- Some students divide the output values instead of subtracting them, or divide by one endpoint instead of the interval length. Others mistake a graph's height for its rate or assume a curved graph has one rate everywhere.
How to Assess It
- Show a graph of y=x² on an exit ticket. Ask students to estimate the average rate from x=1 to x=3, check it using the formula, and explain what the result means.
Lesson moves
Ways to Teach It
Plot y=|x-2| on grid paper, stretch a string between x=0 and x=4, and calculate its slope.
Ask, 'Why is the average rate of y=x² from 0 to 2 different from its rate from 2 to 4?'
Hand out cards for y=2x+1, y=x², y=2^x, and y=|x| on [1,3]; students match each to a rate card.
Give a table of bacteria counts at hours 0, 1, and 2: 100, 200, 400; compare growth per hour.
Free download
Printable A1P.AF.H.29 Worksheet
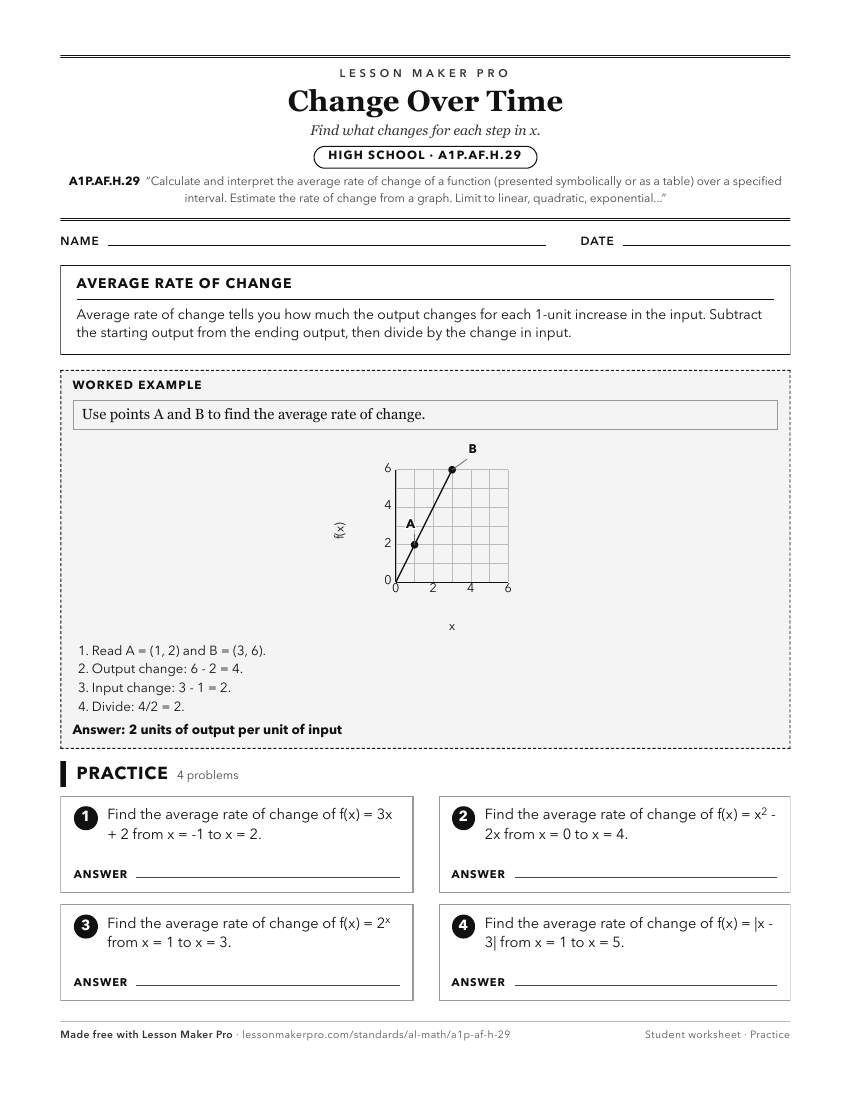
A ready-to-print activity worksheet aligned to A1P.AF.H.29, with an answer key for the teacher on its own page. No account needed.
PDF, US Letter, prints cleanly in black and white.
Download the worksheetKeep exploring
Related Standards
- 8A.AF.J.31
Calculate and interpret the average rate of change of a function (presented symbolically or as a table) over a specified interval. Estimate the rate of change f...
- A2S.AF.H.19
Calculate and interpret the average rate of change of a function (presented symbolically or as a table) over a specified interval. Estimate the rate of change f...
- PC.F.A.25
Calculate and interpret the average rate of change of a function (presented symbolically or as a table) over a specified interval. Estimate the rate of change f...
- PC.F.A.25.b
Explore how the average rate of change of a function over an interval (presented symbolically or as a table) can be used to approximate the instantaneous rate o...
Turn this exact standard into a lesson
Grade, subject, topic, and the complete standard are prefilled. Create one free, no account needed.
Also for this standard:Make a WorksheetMake a QuizMake a Sub Lesson