Alabama Math 8A.AF.J.31
The Standard
- 8A.AF.J
- Functions can be represented graphically and key features of the graphs, including zeros, intercepts, and, when relevant, rate of change and maximum/minimum values, can be associated with and interpreted in terms of the equivalent symbolic representation.
Calculate and interpret the average rate of change of a function (presented symbolically or as a table) over a specified interval. Estimate the rate of change from a graph. Limit to linear, quadratic, exponential, and absolute value functions.
2019 Alabama Course of Study: Mathematics
Teacher's field guide
What This Standard Means
What Students Need to Do
- Students find how much a function’s output changes per unit of input over a given interval. They calculate this from a formula or table, or estimate it from a graph.
What Mastery Looks Like
- A student subtracts the endpoint outputs and divides by the change in inputs. They can explain what the result means, including its sign and units, even when the graph curves or changes direction.
Common Misconceptions
- Students may divide the endpoint outputs instead of finding their difference. On a curved graph, they may use the steepness at one point instead of the average across the interval.
How to Assess It
- Exit ticket: For f(x) = x², find the average rate of change from x = 1 to x = 3. Explain what your answer says about output per unit of input.
Lesson moves
Ways to Teach It
Plot y = x² on graph paper, then stretch string across the intervals from x = 0 to 2 and x = 2 to 4 to compare average rates.
Show y = |x| and ask, “How can the average rate from x = −2 to x = 2 be zero if the graph is never flat?”
Give pairs a table for y = 2^x at x = 0, 1, 2, 3, 4; call out intervals for them to calculate and check.
Give students a phone battery log: 80% at 9:00 and 62% at 12:00; have them calculate the percentage point change per hour.
Free download
Printable 8A.AF.J.31 Worksheet
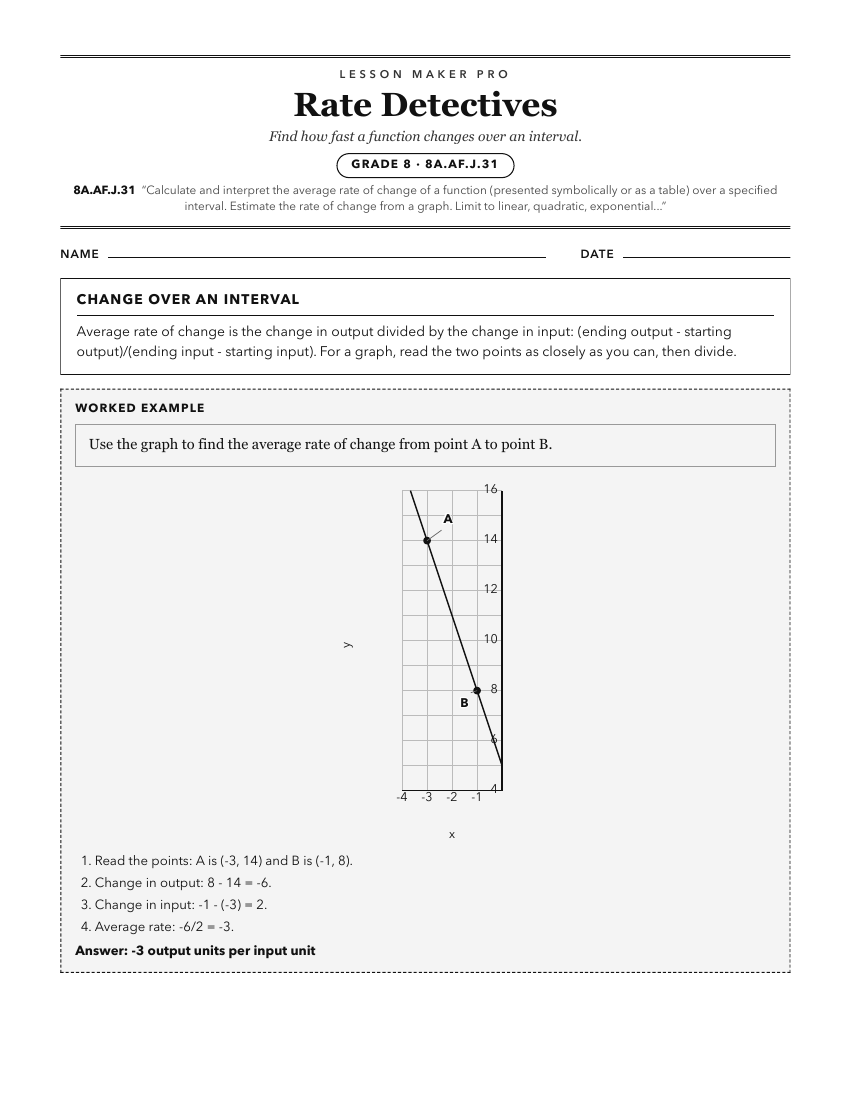
A ready-to-print activity worksheet aligned to 8A.AF.J.31, with an answer key for the teacher on its own page. No account needed.
PDF, US Letter, prints cleanly in black and white.
Download the worksheetKeep exploring
Related Standards
- A1P.AF.H.29
Calculate and interpret the average rate of change of a function (presented symbolically or as a table) over a specified interval. Estimate the rate of change f...
- A2S.AF.H.19
Calculate and interpret the average rate of change of a function (presented symbolically or as a table) over a specified interval. Estimate the rate of change f...
- PC.F.A.25
Calculate and interpret the average rate of change of a function (presented symbolically or as a table) over a specified interval. Estimate the rate of change f...
- PC.F.A.25.b
Explore how the average rate of change of a function over an interval (presented symbolically or as a table) can be used to approximate the instantaneous rate o...
Turn this exact standard into a lesson
Grade, subject, topic, and the complete standard are prefilled. Create one free, no account needed.
Also for this standard:Make a WorksheetMake a QuizMake a Sub Lesson