Alabama Math 8A.DSP.D
Standard Cluster
Data analysis techniques can be used to develop models of contextual situations and to generate and evaluate possible solutions to real problems involving those contexts.
2019 Alabama Course of Study: Mathematics · Grade 8 Accelerated Standards
Cluster contents
Standards in This Cluster
8A.DSP.D is a cluster heading. These are the individual standards under it.
- 8A.DSP.D.40
Generate a two-way categorical table in order to find and evaluate solutions to real-world problems.
- 8A.DSP.D.40.a
Aggregate data from several groups to find an overall association between two categorical variables.
- 8A.DSP.D.40.b
Recognize and explore situations where the association between two categorical variables is reversed when a third variable is considered (Simpson's Paradox).
Teacher's field guide
What This Cluster Means
What Students Need to Do
- Students graph data from a real situation and use the pattern to build a model. They use it to predict an outcome, compare possible solutions, and explain which solution the data support.
What Mastery Looks Like
- Given lunch counts and food-waste weights, a student fits a reasonable line and predicts waste for 250 lunches. They compare two ways to cut waste, show the expected savings, and explain when the prediction might not hold.
Common Misconceptions
- Students may think a model must pass through every data point or treat one unusual day as typical. They may assume a trend proves what caused the waste, or trust a prediction far outside the recorded lunch counts.
How to Assess It
- Exit ticket: A cafeteria wastes 12, 16, and 20 kilograms at 100, 150, and 200 lunches. Predict waste at 250 lunches, then compare a 20% reduction with removing 6 kilograms. Which saves more, and why?
Lesson moves
Ways to Teach It
Give pairs five cards showing lunches served and kilograms wasted: (100,12), (150,16), (200,20), (250,24), (300,28); plot them on graph paper.
At 250 lunches, which saves more, a 20% waste cut or removing 6 kilograms? Explain using the graph.
Run a prediction relay: teams fit a line to the five cards, predict waste at 225 lunches, and check another team's work.
Have students draft a memo to the cafeteria manager recommending one waste-cutting plan and explaining how five days of waste records would test it.
Free download
Printable 8A.DSP.D Worksheet
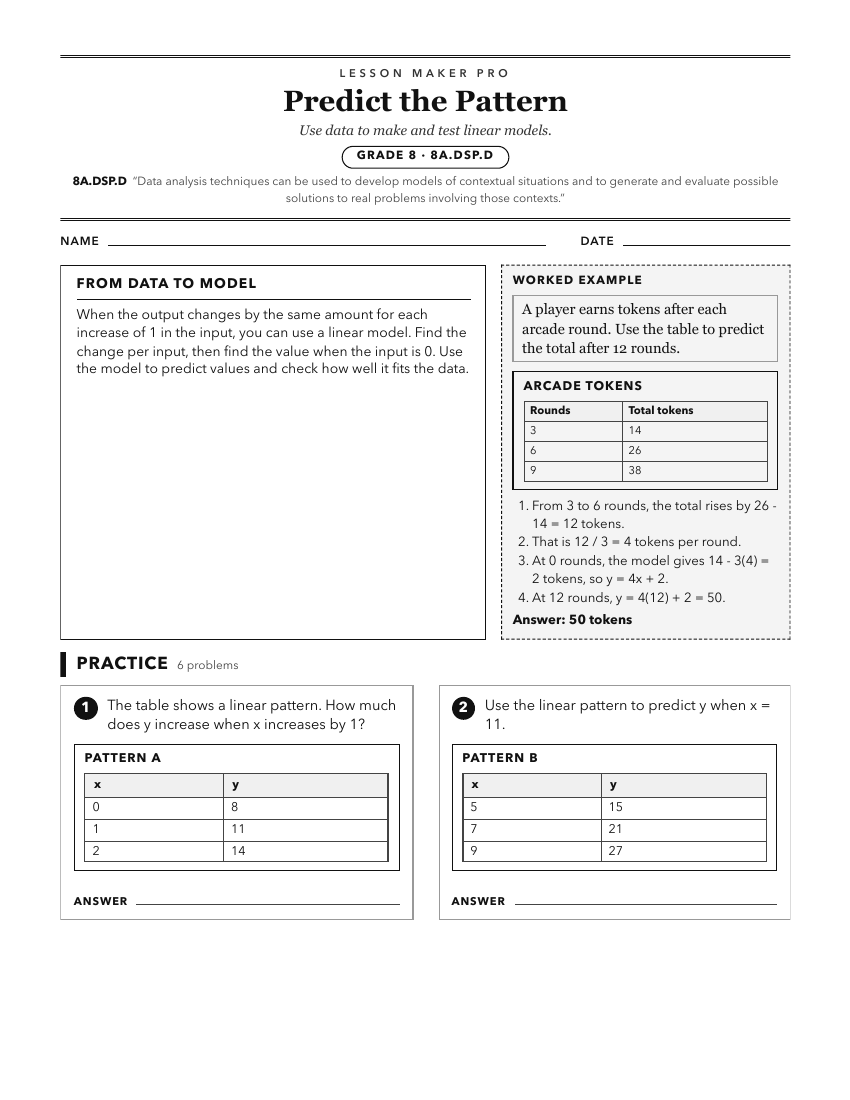
A ready-to-print activity worksheet aligned to 8A.DSP.D, with an answer key for the teacher on its own page. No account needed.
PDF, US Letter, prints cleanly in black and white.
Download the worksheetKeep exploring
Related Standards
- A1P.DSP.E
Data analysis techniques can be used to develop models of contextual situations and to generate and evaluate possible solutions to real problems involving those...
- GDA.DSP.F
Data analysis techniques can be used to develop models of contextual situations and to generate and evaluate possible solutions to real problems involving those...
- GDA.DSP.F.15
Evaluate possible solutions to real-life problems by developing linear models of contextual situations and using them to predict unknown values.
- 8A.AF.K
Functions model a wide variety of real situations and can help students understand the processes of making and changing assumptions, assigning variables, and fi...
Turn this cluster into a lesson
Grade, subject, topic, and the complete cluster are prefilled. Create one free, no account needed.
Also for this cluster:Make a WorksheetMake a QuizMake a Sub Lesson