Alabama Math A1P.DSP.E
Standard Cluster
Data analysis techniques can be used to develop models of contextual situations and to generate and evaluate possible solutions to real problems involving those contexts.
2019 Alabama Course of Study: Mathematics · Algebra I With Probability
Cluster contents
Standards in This Cluster
A1P.DSP.E is a cluster heading. These are the individual standards under it.
- A1P.DSP.E.36
Generate a two-way categorical table in order to find and evaluate solutions to real-world problems.
- A1P.DSP.E.36.a
Aggregate data from several groups to find an overall association between two categorical variables.
- A1P.DSP.E.36.b
Recognize and explore situations where the association between two categorical variables is reversed when a third variable is considered (Simpson's Paradox).
Teacher's field guide
What This Cluster Means
What Students Need to Do
- Students graph data from a familiar situation and use the pattern to make a prediction. They compare possible fixes and decide which one the data support.
What Mastery Looks Like
- Given lunch line lengths and wait times, a student draws a reasonable trend line and predicts a wait for a new line length. They use that prediction to compare two line setups and explain where the prediction might be unreliable.
Common Misconceptions
- Students may think a trend line must pass through every point. They may assume cutting a line in half always cuts the wait in half, or trust a prediction far beyond the measured data.
How to Assess It
- Exit ticket: For 4, 8, 12, and 16 people ahead, waits are 3, 5, 7, and 9 minutes. Predict the wait with 20 ahead, then decide whether splitting those 20 people into two equal lines would keep waits under 10 minutes. Show your reasoning.
Lesson moves
Ways to Teach It
Use stacks of 5, 10, and 15 index cards as lunch lines, time a partner processing each stack, and graph the results.
Write to the principal: Would two registers serving 10 students each beat one serving 20? Cite your graph and name one assumption.
Play best fix: Teams use wait data (5,4), (10,7), and (15,10) to compare one line of 20 with two lines of 10.
Give students bus delays of 2, 4, 7, 9, and 3 minutes; have them check whether a five-minute buffer covers each day.
Free download
Printable A1P.DSP.E Worksheet
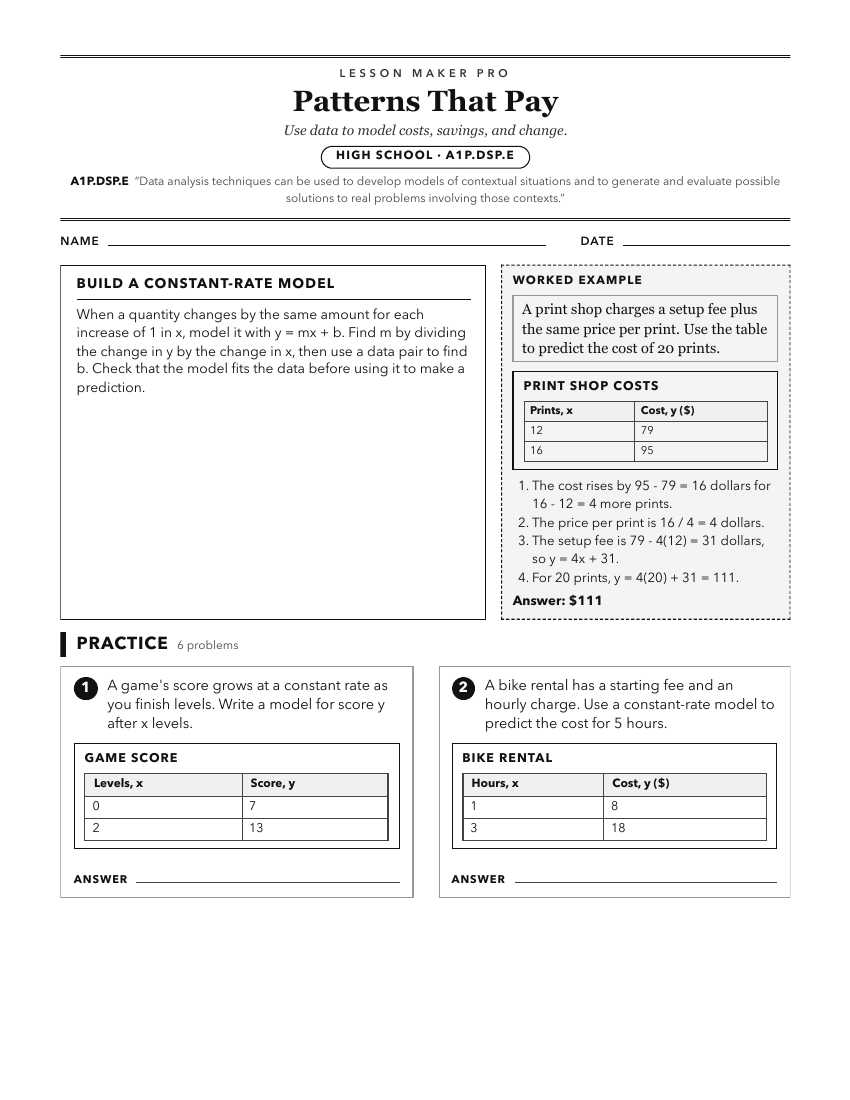
A ready-to-print activity worksheet aligned to A1P.DSP.E, with an answer key for the teacher on its own page. No account needed.
PDF, US Letter, prints cleanly in black and white.
Download the worksheetKeep exploring
Related Standards
- 8A.DSP.D
Data analysis techniques can be used to develop models of contextual situations and to generate and evaluate possible solutions to real problems involving those...
- GDA.DSP.F
Data analysis techniques can be used to develop models of contextual situations and to generate and evaluate possible solutions to real problems involving those...
- GDA.DSP.F.15
Evaluate possible solutions to real-life problems by developing linear models of contextual situations and using them to predict unknown values.
- 8A.AF.K
Functions model a wide variety of real situations and can help students understand the processes of making and changing assumptions, assigning variables, and fi...
Turn this cluster into a lesson
Grade, subject, topic, and the complete cluster are prefilled. Create one free, no account needed.
Also for this cluster:Make a WorksheetMake a QuizMake a Sub Lesson