Alabama Math A1P.DSP.E.36.b
The Standard
- A1P.DSP.E
- Data analysis techniques can be used to develop models of contextual situations and to generate and evaluate possible solutions to real problems involving those contexts.
- A1P.DSP.E.36
- Generate a two-way categorical table in order to find and evaluate solutions to real-world problems.
Recognize and explore situations where the association between two categorical variables is reversed when a third variable is considered (Simpson's Paradox).
2019 Alabama Course of Study: Mathematics · Data analysis techniques can be used to develop models of contextual situations and to generate and evaluate possible solutions to real problems involving those contexts.
Teacher's field guide
What This Standard Means
What Students Need to Do
- Students compare overall success rates, then split the data by a third factor and compare again. They spot when the ranking flips and explain how uneven group sizes produce the flip.
What Mastery Looks Like
- A student calculates rates from counts rather than comparing totals. They identify which option leads in each subgroup and overall, then use the subgroup sizes to explain the difference.
Common Misconceptions
- Students may compare success counts or average subgroup percentages without accounting for group size. They may assume the overall rate is always the fairest comparison, or think a flipped ranking means the arithmetic is wrong.
How to Assess It
- Exit ticket: Mild cases, A 9/10 and B 80/100; severe cases, A 20/100 and B 1/10. Which treatment has a higher success rate in each group and overall, and why do the rankings flip?
Lesson moves
Ways to Teach It
Hand pairs four cards: mild A 9/10, mild B 80/100, severe A 20/100, severe B 1/10; sort by severity, then treatment, and calculate rates.
Ask: "Why can B lead overall when A leads for both mild and severe cases? Which cases make up most of B's total?"
Race teams to compute overall rates: mild A 9/10, mild B 80/100, severe A 20/100, severe B 1/10; award points for explaining the reversal.
Show a hospital report with A's 9/10 mild and 20/100 severe recoveries and B's 80/100 mild and 1/10 severe; ask which comparison misleads.
Free download
Printable A1P.DSP.E.36.b Worksheet
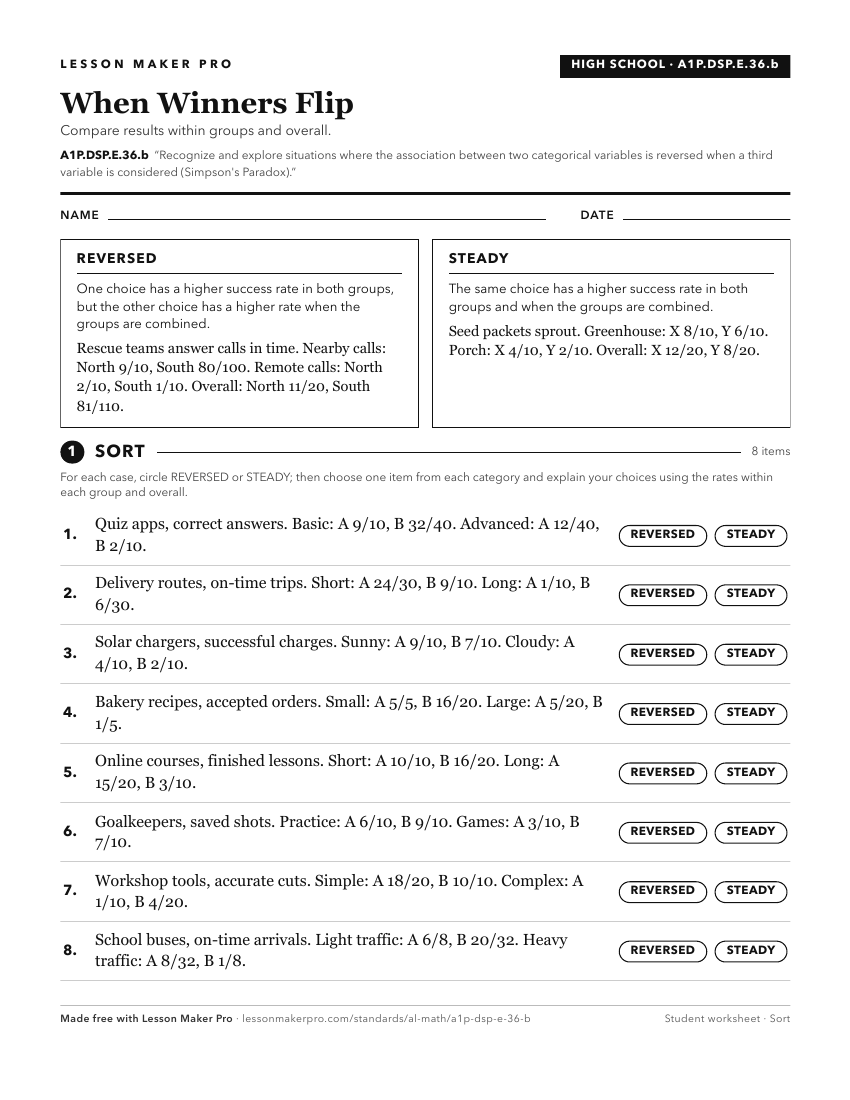
A ready-to-print activity worksheet aligned to A1P.DSP.E.36.b, with an answer key for the teacher on its own page. No account needed.
PDF, US Letter, prints cleanly in black and white.
Download the worksheetKeep exploring
Related Standards
- 8A.DSP.D.40.b
Recognize and explore situations where the association between two categorical variables is reversed when a third variable is considered (Simpson's Paradox).
- 8A.DSP.C.39
Analyze the possible association between two categorical variables.
- A1P.DSP.D.35
Analyze the possible association between two categorical variables.
- 8A.DSP.C.39.c
Identify possible associations and trends in categorical data.
Turn this exact standard into a lesson
Grade, subject, topic, and the complete standard are prefilled. Create one free, no account needed.
Also for this standard:Make a WorksheetMake a QuizMake a Sub Lesson