Alabama Math 8A.DSP.D.40
Standard Cluster
- 8A.DSP.D
- Data analysis techniques can be used to develop models of contextual situations and to generate and evaluate possible solutions to real problems involving those contexts.
Generate a two-way categorical table in order to find and evaluate solutions to real-world problems. a. Aggregate data from several groups to find an overall association between two categorical variables. b. Recognize and explore situations where the association between two categorical variables is reversed when a third variable is considered (Simpson’s Paradox).
2019 Alabama Course of Study: Mathematics
Cluster contents
Standards in This Cluster
8A.DSP.D.40 is a cluster heading. These are the individual standards under it.
Teacher's field guide
What This Cluster Means
What Students Need to Do
- Students organize counts for two categories in a two-way table. They combine data from several groups, compare percentages, and check whether a third category reverses the overall pattern.
What Mastery Looks Like
- A student builds tables for each group and for the combined data. They can show when the overall comparison reverses within the groups and explain how different group sizes affect the result.
Common Misconceptions
- Students may compare raw counts when groups are different sizes. They may add percentages instead of counts or assume the overall pattern must hold in every group.
How to Assess It
- Give this exit ticket: Player A made 9 of 10 easy shots and 20 of 40 hard shots. Player B made 32 of 40 easy shots and 4 of 10 hard shots. Make tables, compare each player's rates by shot type and overall, and explain the reversal.
Lesson moves
Ways to Teach It
Give pairs 100 shot slips: A easy 9/10, hard 20/40; B easy 32/40, hard 4/10. Sort them and tally makes and misses.
Ask, 'Why does B lead overall when A leads on both easy and hard shots?' Have students point to the group sizes.
Run a table race: teams make easy, hard, and combined tables from the shot slips, then circle the reversed comparison.
Compare two stores' sales: A sells to 9/10 morning and 20/40 evening visitors; B sells to 32/40 morning and 4/10 evening visitors.
Free download
Printable 8A.DSP.D.40 Worksheet
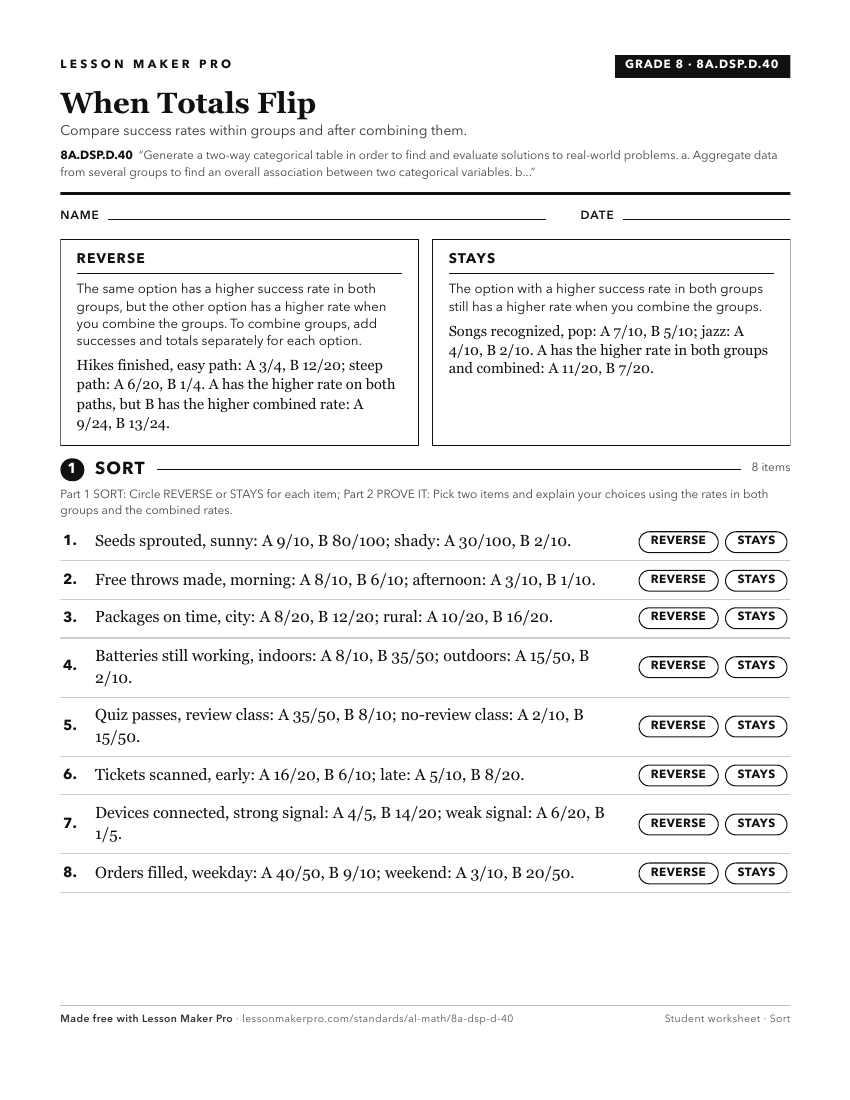
A ready-to-print activity worksheet aligned to 8A.DSP.D.40, with an answer key for the teacher on its own page. No account needed.
PDF, US Letter, prints cleanly in black and white.
Download the worksheetKeep exploring
Related Standards
Turn this cluster into a lesson
Grade, subject, topic, and the complete cluster are prefilled. Create one free, no account needed.
Also for this cluster:Make a WorksheetMake a QuizMake a Sub Lesson