Alabama Math 8A.DSP.D.40.a
The Standard
- 8A.DSP.D
- Data analysis techniques can be used to develop models of contextual situations and to generate and evaluate possible solutions to real problems involving those contexts.
- 8A.DSP.D.40
- Generate a two-way categorical table in order to find and evaluate solutions to real-world problems.
Aggregate data from several groups to find an overall association between two categorical variables.
2019 Alabama Course of Study: Mathematics · Data analysis techniques can be used to develop models of contextual situations and to generate and evaluate possible solutions to real problems involving those contexts.
Teacher's field guide
What This Standard Means
What Students Need to Do
- Students add matching counts from several groups to make one two-way table. They compare percentages to see whether two categories are related overall.
What Mastery Looks Like
- Given lunch and travel counts from several homerooms, students combine the counts correctly. They compare the percent of bus riders who pack lunch with the percent of walkers who pack lunch, then describe the overall pattern.
Common Misconceptions
- Students may average group percentages instead of combining counts, even when the groups differ in size. They may compare raw counts when the bus and walk groups differ in size, or assume the overall pattern holds in every homeroom.
How to Assess It
- Exit ticket: Homeroom A has 4 bus riders who pack lunch and 6 who buy, plus 3 walkers who pack and 7 who buy. Homeroom B has 6 bus riders who pack and 4 who buy, plus 2 walkers who pack and 8 who buy. Combine the counts, find each travel group's packing rate, and describe the overall pattern.
Lesson moves
Ways to Teach It
Give pairs student cards from three homerooms, each labeled bus or walk and pack or buy; sort and pool counts in a two-way table.
Have students write whether bus riders or walkers pack lunch more often across the homerooms, using two calculated percentages.
Run a table relay: teams pool three homeroom tally cards, calculate packing rates by travel mode, then check another team's totals.
Compare lunch choices across three fictional homerooms and use the overall rates to estimate cafeteria meals needed for incoming bus riders.
Free download
Printable 8A.DSP.D.40.a Worksheet
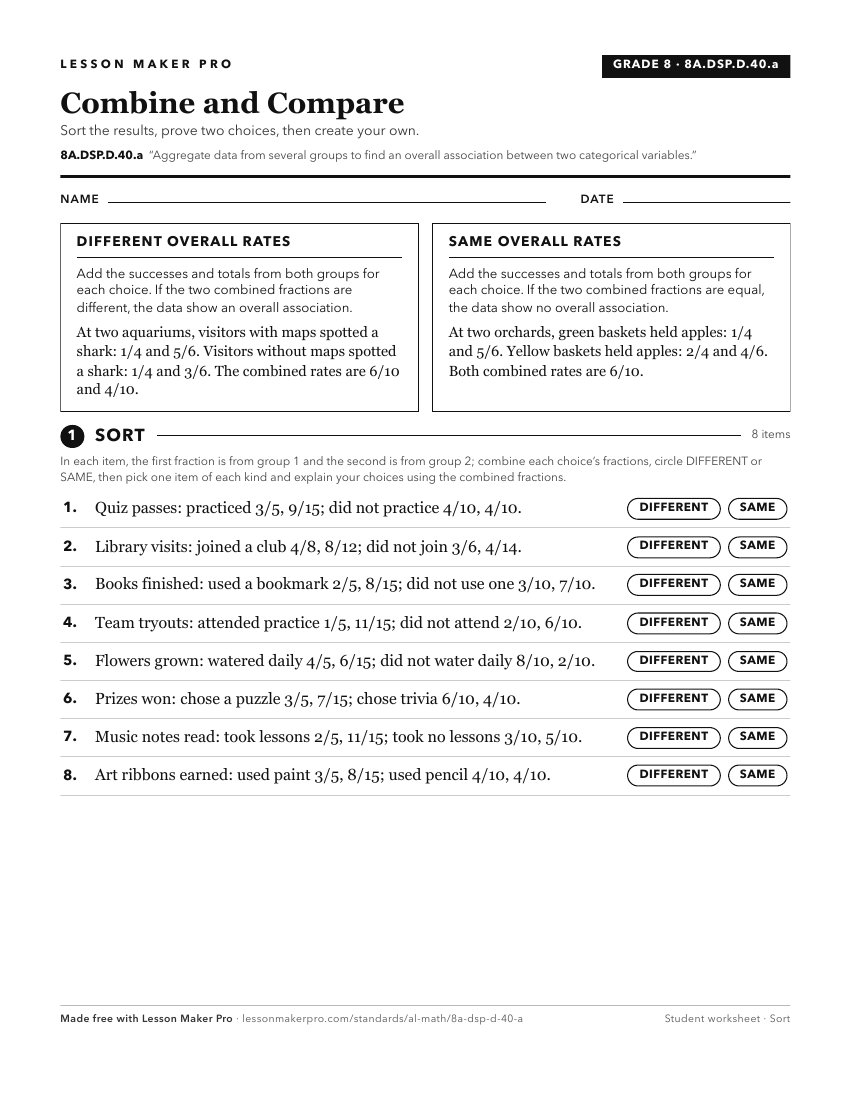
A ready-to-print activity worksheet aligned to 8A.DSP.D.40.a, with an answer key for the teacher on its own page. No account needed.
PDF, US Letter, prints cleanly in black and white.
Download the worksheetKeep exploring
Related Standards
- A1P.DSP.E.36.a
Aggregate data from several groups to find an overall association between two categorical variables.
- A1P.DSP.D.35
Analyze the possible association between two categorical variables.
- 8A.DSP.C.39
Analyze the possible association between two categorical variables.
- 8A.DSP.C.39.c
Identify possible associations and trends in categorical data.
Turn this exact standard into a lesson
Grade, subject, topic, and the complete standard are prefilled. Create one free, no account needed.
Also for this standard:Make a WorksheetMake a QuizMake a Sub Lesson