Virginia SOL WG.13.a
The Standard
- WG.13
- The student will apply history and social science skills to understand population and migration by
explaining how data is used to describe and compare populations
Virginia Standards of Learning for History and Social Science · The student will apply history and social science skills to understand population and migration by
Teacher's field guide
What This Standard Means
What Students Need to Do
- Students read population tables, graphs, and maps. They use measures such as total population, density, growth rate, and age structure to make evidence-based comparisons.
What Mastery Looks Like
- Students choose a measure that fits the comparison and cite correct values. They explain patterns without confusing totals, rates, percentages, or density.
Common Misconceptions
- Students often assume the country with more people also has greater population density. They may compare raw totals when percentages or rates would give a fairer comparison.
How to Assess It
- Give students this prompt: Country A has 80 million people and 250 people per square mile. Country B has 110 million people and 90 people per square mile. Write two accurate comparison statements.
Lesson moves
Ways to Teach It
Give pairs country data cards, then have students rank countries by population, density, growth rate, and median age.
Ask students to write which population measure best predicts the need for new schools, then support their choice with data.
Play Claim Check by showing population statements and having teams verify each claim using a table or graph.
Use Census QuickFacts to compare your community with another place and identify one likely difference in public service needs.
Free download
Printable WG.13.a Worksheet
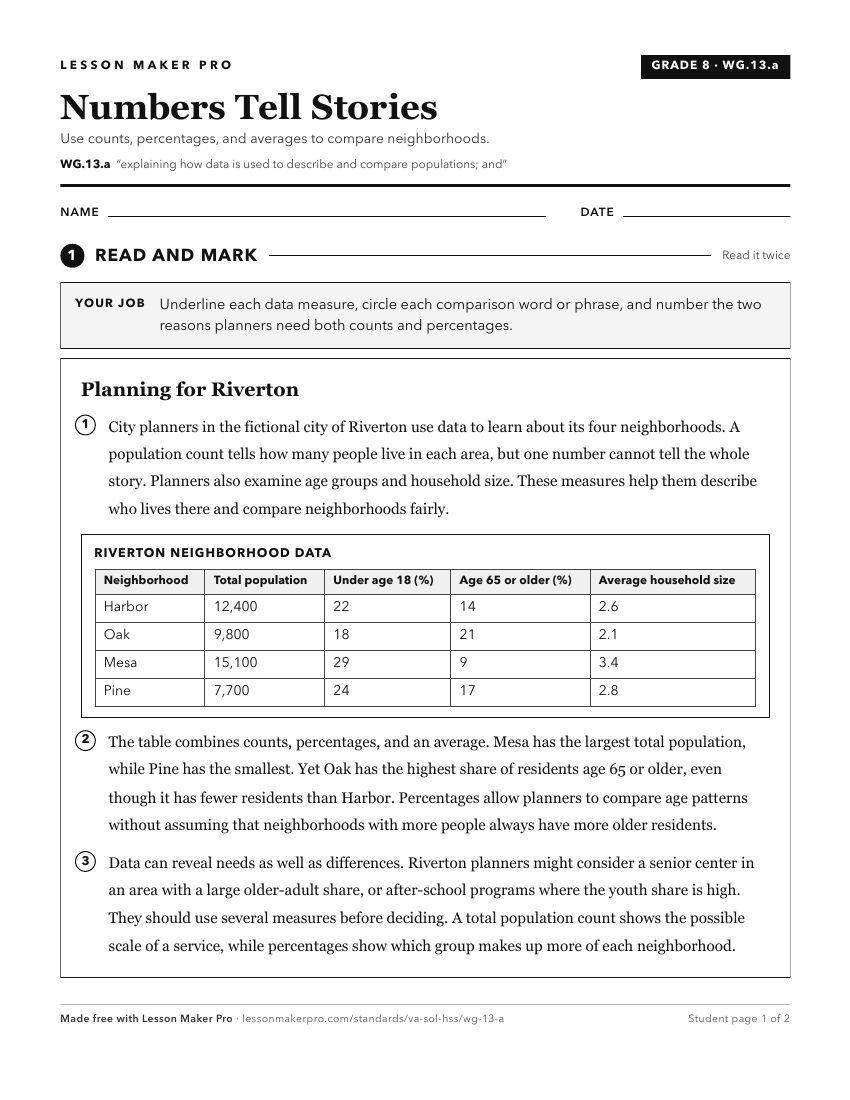
A ready-to-print activity worksheet aligned to WG.13.a, with an answer key for the teacher on its own page. No account needed.
PDF, US Letter, prints cleanly in black and white.
Download the worksheetKeep exploring
Related Standards
- WG.12
The student will apply social science skills to understand the distribution, growth rates, and characteristics of human population by
- WG.13
The student will apply history and social science skills to understand population and migration by
- 3.3.c
describing how geographic features have impacted the lives of individuals
- WG.12.a
examining the relationship between demographic data to determine the level of economic development
Turn this exact standard into a lesson
Grade, subject, topic, and the complete standard are prefilled. Create one free, no account needed.
Also for this standard:Make a WorksheetMake a QuizMake a Sub Lesson