Virginia SOL WG.12
SOL Standard (Skills Cluster)
The student will apply social science skills to understand the distribution, growth rates, and characteristics of human population by examining the relationship between demographic data to determine the level of economic development; distinguishing between developed and developing countries; and comparing and contrasting the level of economic development to the standard of living, quality of life, form of government, personal freedom, and economic opportunity.
Virginia Standards of Learning for History and Social Science
Cluster contents
Skills in This Standard
WG.12 is a Standards of Learning history and social science standard. These are the skills expectations under it.
- WG.12.a
examining the relationship between demographic data to determine the level of economic development
- WG.12.b
distinguishing between developed and developing countries
- WG.12.c
comparing and contrasting the level of economic development to the standard of living, quality of life, form of government, personal freedom, and economic oppor...
Teacher's field guide
What This Cluster Means
What Students Need to Do
- Students read measures such as birth rate, life expectancy, literacy, and income per person. They use patterns across several measures to estimate development and connect it with living conditions, government, freedom, and opportunity.
What Mastery Looks Like
- Given a data table, a student classifies countries and cites at least three indicators that support each choice. The student compares two countries without claiming that income alone determines freedom, government, or quality of life.
Common Misconceptions
- Students often think a large population means a country is developing, or that low population growth always means decline. They may use income alone or confuse standard of living with quality of life. They may also treat development labels as permanent.
How to Assess It
- Give students data for Country A: birth rate 11, life expectancy 81, literacy 99 percent, income $48,000, and Country B: 31, 65, 72 percent, and $4,000. Ask them to classify each country, cite three indicators, and predict one difference in economic opportunity.
Lesson moves
Ways to Teach It
Give pairs country cards with birth rate, life expectancy, literacy, and income data; students sort them into development groups and label their evidence.
Students respond to the prompt, “Can a country have high income but low quality of life?”, using government, freedom, and health examples.
Play Indicator Match: teams pair data clues with likely development levels, then earn a point by explaining each match aloud.
Have students compare census and development data for Virginia and one selected country, then identify one likely difference in economic opportunity.
Free download
Printable WG.12 Worksheet
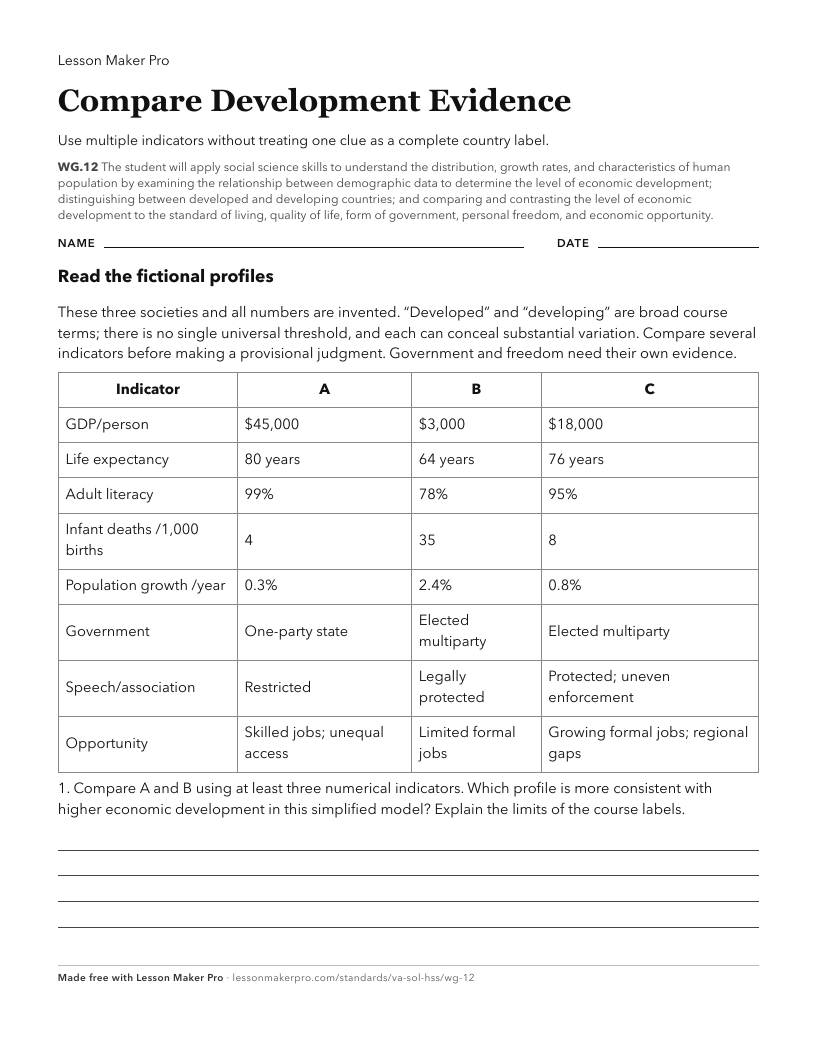
A ready-to-print activity worksheet aligned to WG.12, with an answer key for the teacher on its own page. No account needed.
PDF, US Letter, prints cleanly in black and white.
Download the worksheetKeep exploring
Related Standards
- WG.15
The student will apply history and social science skills to analyze the patterns of rural and urban migration and development by
- WG.16
The student will apply history and social science skills to understand the impact of the growing interdependence of the world by
- WG.14
The student will apply history and social science skills to determine cultural patterns and interactions across time and place by
- WG.13
The student will apply history and social science skills to understand population and migration by
Turn this cluster into a lesson
Grade, subject, topic, and the complete cluster are prefilled. Create one free, no account needed.
Also for this cluster:Make a WorksheetMake a QuizMake a Sub Lesson