TEKS Math 8.1.F
The Standard
analyze mathematical relationships to connect and communicate mathematical ideas
Texas Essential Knowledge and Skills for Mathematics
Teacher's field guide
What This Standard Means
What Students Need to Do
- Students compare tables, graphs, equations, diagrams, and situations to identify how quantities are connected. They explain the same pattern in different forms and justify their conclusions with mathematical evidence.
What Mastery Looks Like
- Given an unfamiliar situation, students choose useful representations and connect specific features across them. They explain how one quantity changes with another and support claims with values, labels, or calculations.
Common Misconceptions
- Students may treat tables, graphs, equations, and diagrams as unrelated instead of different views of one relationship. They may say a pattern increases without identifying its rate, starting value, scale, or supporting evidence.
How to Assess It
- Give the table with x-values 0, 1, 2 and y-values 3, 5, 7. Ask students to write an equation, sketch a graph, and explain how all three representations match.
Lesson moves
Ways to Teach It
Build tile staircases, record step number and tile count, then make a table, graph, and rule that show the same pattern.
Show y = 3x + 2 as a table and graph, then ask, “Where do the 3 and 2 appear in each?”
Run a card sort matching contexts, tables, graphs, and equations, with partners writing one evidence sentence for every match.
Use a taxi’s base fee and per-mile charge to create two models, compare costs, and explain when each ride is cheaper.
Free download
Printable 8.1.F Worksheet
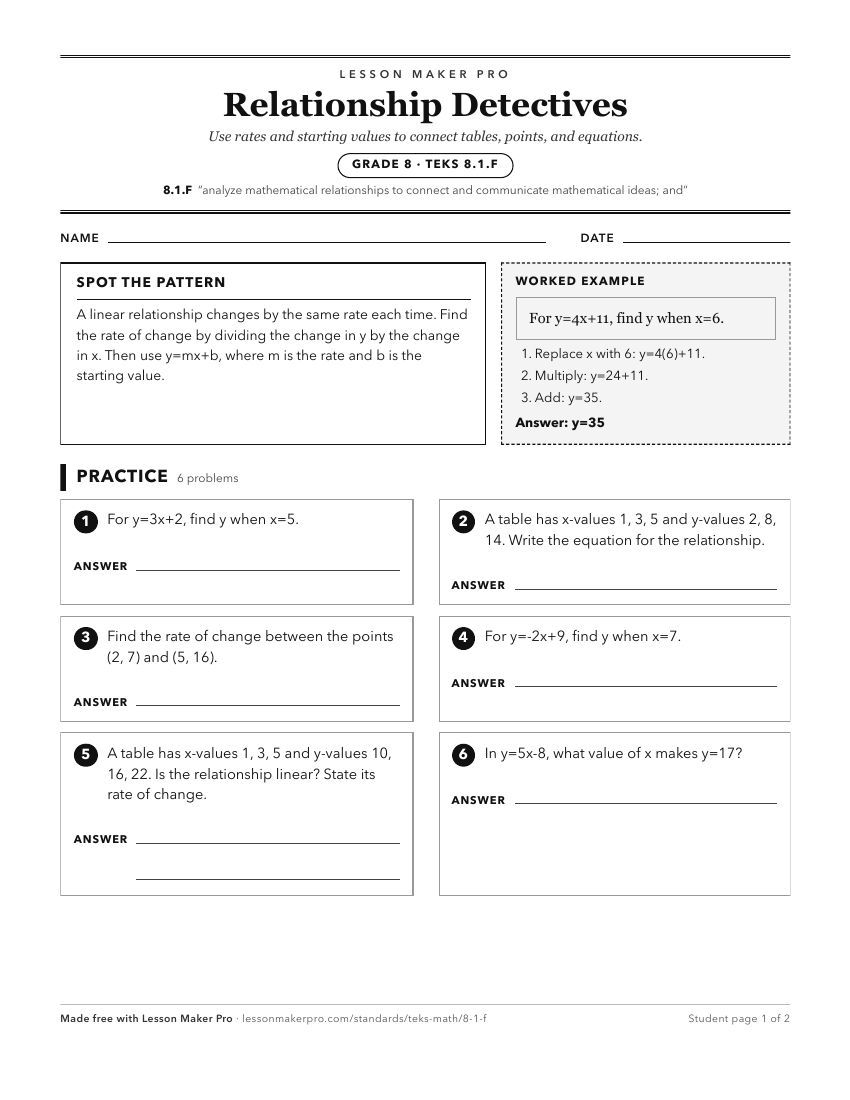
A ready-to-print activity worksheet aligned to 8.1.F, with an answer key for the teacher on its own page. No account needed.
PDF, US Letter, prints cleanly in black and white.
Download the worksheetKeep exploring
Related Standards
Turn this exact standard into a lesson
Grade, subject, topic, and the complete standard are prefilled. Create one free, no account needed.
Also for this standard:Make a WorksheetMake a QuizMake a Sub Lesson