Oklahoma Social Studies PS.1.4
The Standard
- PS.1
- Examine the foundations of psychology and its origins as an empirical science.
Identify and evaluate psychological concepts in representations of data, including tables, graphs, charts, figures, and diagrams.
Oklahoma Academic Standards for Social Studies (2026) · PS.1
Teacher's field guide
What This Standard Means
What Students Need to Do
- Students read tables, graphs, and other displays of behavior or mental processes. They name the psychological concept the data might represent, describe the pattern, and check whether the evidence supports a claim.
What Mastery Looks Like
- Given a graph of sleep hours and reaction time, a student identifies alertness as a possible concept and cites values that show the trend. They explain that the graph alone cannot prove sleep caused the change.
Common Misconceptions
- Students may treat reaction time as a direct measure of intelligence or assume a taller bar always means better performance. They may mistake a link for proof of cause or miss an axis that exaggerates a difference.
How to Assess It
- Make a two-column table: sleep hours 5, 6, 7, 8; reaction times 350, 330, 310, 290 milliseconds. Ask students what reaction time might reveal about alertness, which values show a pattern, and why cause is uncertain.
Lesson moves
Ways to Teach It
Give pairs sleep and reaction-time data cards; have them plot the points on graph paper and label the psychological concept the measure might represent.
Show a graph linking screen time with anxiety scores; ask, 'What can the graph show, and what cannot it prove?'
Run a claim-check game with three graphs of memory scores; students mark each claim supported, unsupported, or missing a key label.
Show a workplace burnout survey chart; students compare its headline with the bars and flag any unsupported claim about employee stress.
Free download
Printable PS.1.4 Worksheet
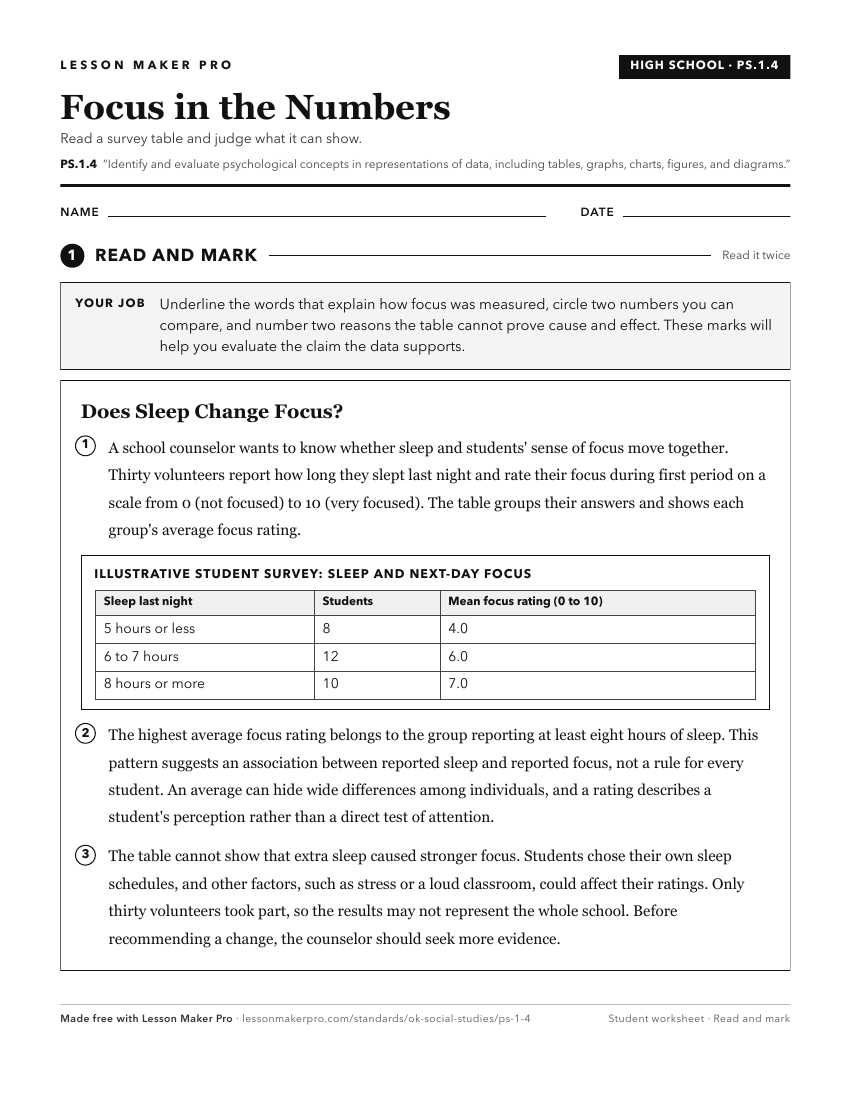
A ready-to-print activity worksheet aligned to PS.1.4, with an answer key for the teacher on its own page. No account needed.
PDF, US Letter, prints cleanly in black and white.
Download the worksheetKeep exploring
Related Standards
- 6.P.2.4.A
Analyze, interpret, and compare economic data from multiple charts and graphs.
- 8.P.2.4.A
Analyze, interpret, and compare economic data from multiple charts and graphs.
- 5.P.2.4.A
Interpret and draw conclusions from economic data on charts and graphs.
- 7.P.2.4.A
Analyze, interpret, and compare economic data from multiple charts and graphs.
Turn this exact standard into a lesson
Grade, subject, topic, and the complete standard are prefilled. Create one free, no account needed.
Also for this standard:Make a WorksheetMake a QuizMake a Sub Lesson