Oklahoma Social Studies 5.P.2.4.A
The Standard
- 5.P.2
- Use interdisciplinary tools to acquire, apply, and evaluate content understanding of the four strands of social studies.
- 5.P.2.4
- Identify the principles of economic systems and develop an understanding of the benefits of a market system in local, national, and global settings.
Interpret and draw conclusions from economic data on charts and graphs.
Oklahoma Academic Standards for Social Studies (2026) · 5.P.2.4
Teacher's field guide
What This Standard Means
What Students Need to Do
- Students read titles, labels, scales, and values on charts and graphs about money or trade. They compare values and use them to support a conclusion.
What Mastery Looks Like
- A student can say which day had the highest sales and give the dollar amounts as evidence. They can spot a change over time without guessing why it happened.
Common Misconceptions
- Students may compare bar heights without checking where the scale starts. They may say sales went up because more people shopped, even when the graph only shows dollars earned.
How to Assess It
- Show a bar graph of school store sales: Monday $10, Tuesday $15, Wednesday $8. Ask, “Which day earned the most, and which values support your answer?”
Lesson moves
Ways to Teach It
Give pairs pencil sales data for three days, then have them build a bar graph using square tiles.
Show a graph of bus fares rising from $1 to $2; ask students to write what changed and cite both values.
Hand out lunch sales graphs and claim cards; students match each claim to a graph and point to supporting values.
Give students two grocery flyers; have them graph prices for the same three items and identify which store costs less.
Free download
Printable 5.P.2.4.A Worksheet
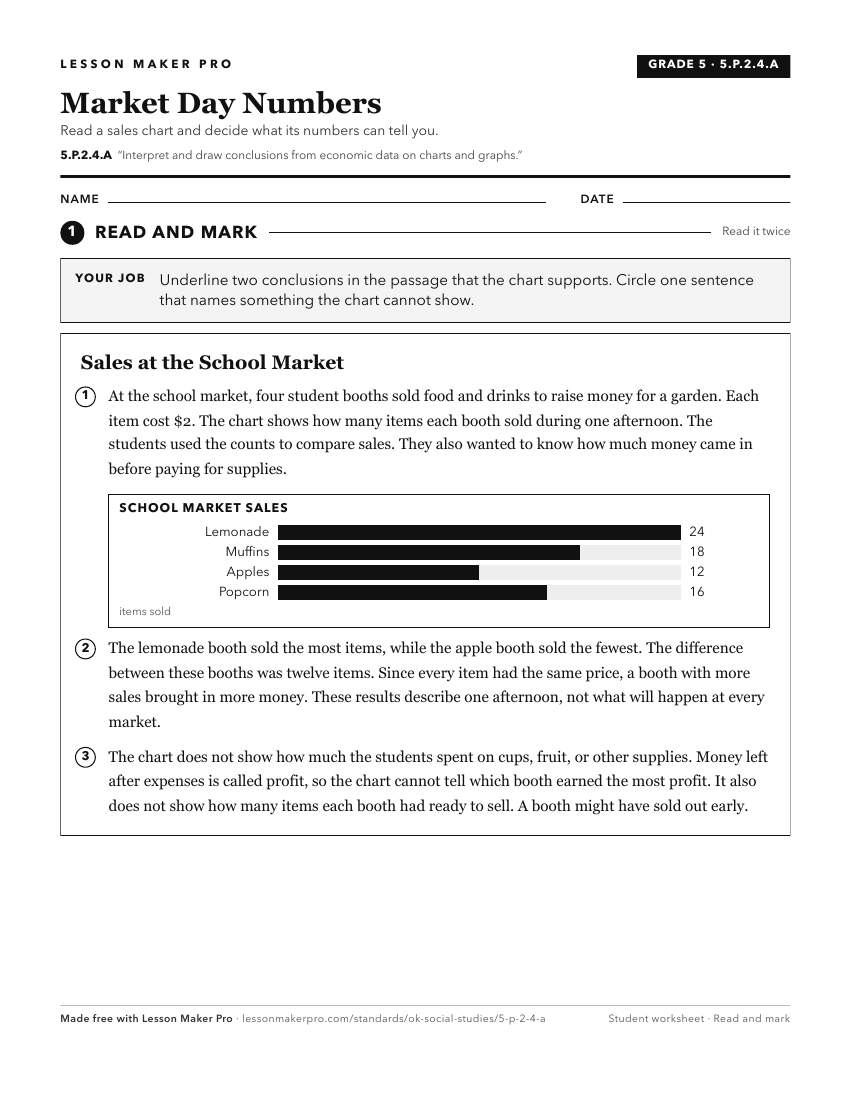
A ready-to-print activity worksheet aligned to 5.P.2.4.A, with an answer key for the teacher on its own page. No account needed.
PDF, US Letter, prints cleanly in black and white.
Download the worksheetKeep exploring
Related Standards
- 6.P.2.4.A
Analyze, interpret, and compare economic data from multiple charts and graphs.
- 8.P.2.4.A
Analyze, interpret, and compare economic data from multiple charts and graphs.
- 7.P.2.4.A
Analyze, interpret, and compare economic data from multiple charts and graphs.
- 4.P.2.4.A
The 4th Grade version of this standard.
Turn this exact standard into a lesson
Grade, subject, topic, and the complete standard are prefilled. Create one free, no account needed.
Also for this standard:Make a WorksheetMake a QuizMake a Sub Lesson