Oklahoma Social Studies E.C.9
Standard Cluster
Identify the basic measures of a nation’s economic output and income. Examine the differences between the nominal and the real GDP (Gross Domestic Product) and explain how GDP and GNP (Gross National Product) are used to describe economic output over time by comparing the GDP of various nations representative of market, command, and mixed economic systems. Describe the impact on the economy when GDP and GNP are growing versus declining. Evaluate the impact of self-interest, competition, collusion, technological advancement, standard of living, the business cycle, and fluctuation on the GDP.
Oklahoma Academic Standards for Social Studies (2026)
Cluster contents
Standards in This Cluster
E.C.9 is a cluster heading. These are the individual standards under it.
- E.C.9.1
Examine the differences between the nominal and the real GDP (Gross Domestic Product) and explain how GDP and GNP (Gross National Product) are used to describe ...
- E.C.9.2
Describe the impact on the economy when GDP and GNP are growing versus declining.
- E.C.9.3
Evaluate the impact of self-interest, competition, collusion, technological advancement, standard of living, the business cycle, and fluctuation on the GDP.
Teacher's field guide
What This Cluster Means
What Students Need to Do
- Students compare GDP and GNP as measures of output and income. They use prices to tell real growth from a rise in nominal GDP. They compare countries with market, command, and mixed economies, then explain what can make output grow or shrink.
What Mastery Looks Like
- A student counts production at home in GDP and residents' production abroad in GNP. Given prices and output for two years, they calculate nominal and real GDP and spot a downturn. They can explain why GDP per person may rise without everyone being better off.
Common Misconceptions
- Students may say output grew when nominal GDP rose, even though prices rose faster. They may count residents' work abroad in GDP or leave production by nonresidents at home out of GDP. Some assume a large GDP means a high living standard for everyone, or that higher prices from collusion mean more output.
How to Assess It
- Exit ticket: Nominal GDP rises from 100 to 110 while prices rise 20%; residents produce 8 abroad and nonresidents produce 3 at home. Did real output grow, is GNP greater than GDP, and why might collusion reduce future output?
Lesson moves
Ways to Teach It
Use price, output, and producer cards to calculate nominal and real GDP, then mark which production counts in GDP, GNP, or both.
Ask partners how a price-fixing deal, a new machine, and rival sellers might each change output and living standards.
Give teams two-year GDP cards for market, command, and mixed economies; award points for spotting inflation, growth, and downturns.
Have students graph World Bank real GDP per person for the United States and China, then mark downturns and discuss what averages hide.
Free download
Printable E.C.9 Worksheet
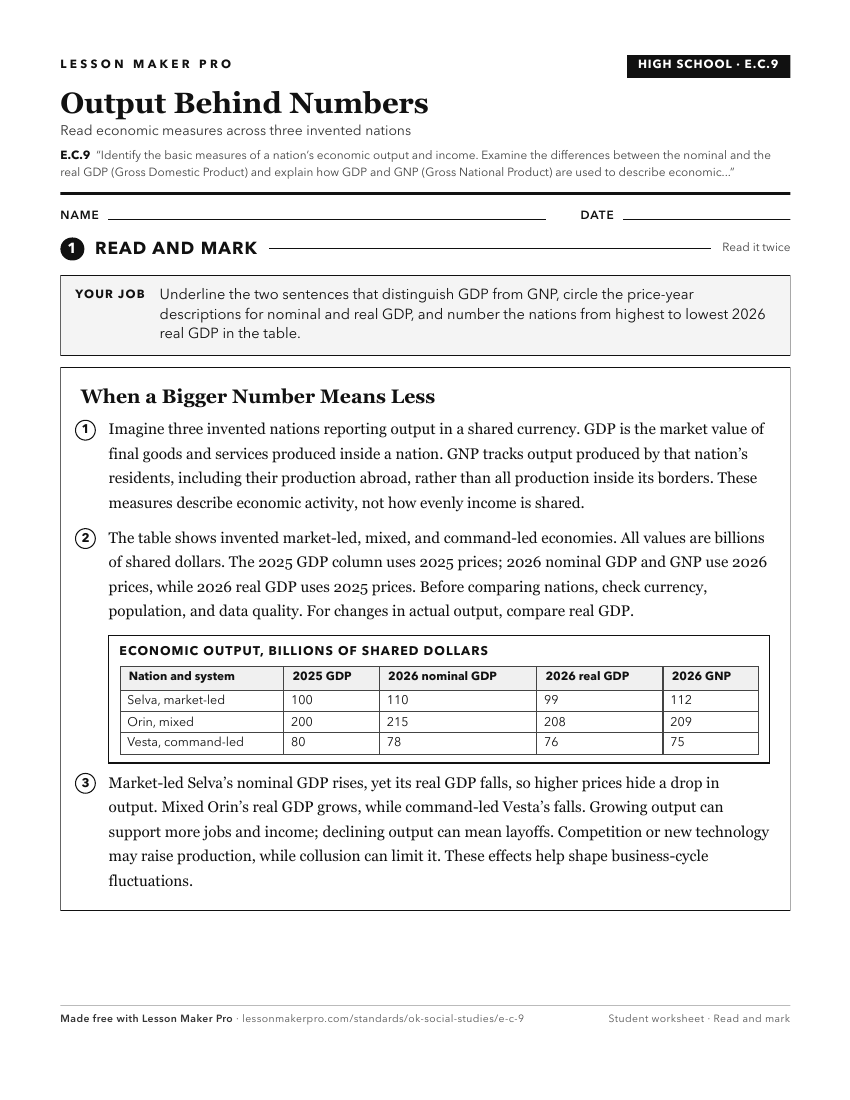
A ready-to-print activity worksheet aligned to E.C.9, with an answer key for the teacher on its own page. No account needed.
PDF, US Letter, prints cleanly in black and white.
Download the worksheetKeep exploring
Related Standards
- 7.C.7.4
Compare the economic measurements of productivity which inform nations of their economic health and growth (e.g., Gross Domestic Product and Gross National Prod...
- 3.P.2.4.A
Gather basic economic data from various types of graphs and charts.
- K.C.4
Identify basic economic concepts.
- 7.C.7.3
Evaluate how the major sectors of economic activities contribute to the development of a country or region:
Turn this cluster into a lesson
Grade, subject, topic, and the complete cluster are prefilled. Create one free, no account needed.
Also for this cluster:Make a WorksheetMake a QuizMake a Sub Lesson