Oklahoma Math 7.A.2
Standard Cluster
Identify and justify proportional relationships using mathematical models and situations; solve problems involving proportional relationships and interpret results in the original context. Represent proportional relationships with tables, verbal descriptions, symbols, and graphs; translate from one representation to another. Determine and compare the unit rate (constant of proportionality, slope, or rate of change) given any of these representations. Solve multi-step problems with proportional relationships (e.g., distance-time, percent increase or decrease, discounts, tips, unit pricing, mixtures and concentrations, similar figures, other mathematical situations). Use proportional reasoning to solve problems involving ratios. Use proportional reasoning to assess the reasonableness of solutions.
Oklahoma Academic Standards for Mathematics (2022)
Cluster contents
Standards in This Cluster
7.A.2 is a cluster heading. These are the individual standards under it.
- 7.A.2.1
Represent proportional relationships with tables, verbal descriptions, symbols, and graphs; translate from one representation to another. Determine and compare ...
- 7.A.2.3
Use proportional reasoning to solve problems involving ratios.
- 7.A.2.4
Use proportional reasoning to assess the reasonableness of solutions.
Teacher's field guide
What This Cluster Means
What Students Need to Do
- Students check whether one quantity is always the same multiple of another and explain how they know. They show the relationship with a table, graph, words, and an equation, then find and compare unit rates. They solve price, percent, distance, and scale problems and check whether their answers make sense.
What Mastery Looks Like
- A student can spot a constant ratio in a table and explain why a graph of the relationship passes through (0, 0). They can turn the table into an equation, name the unit rate with its units, and compare it with another rate. They can solve a discount or travel problem and explain what the answer means.
Common Misconceptions
- Some students call any straight line proportional, even when it does not pass through (0, 0). Others divide the quantities in the wrong order or compare total prices instead of unit prices. They may treat a 20% discount as $20 or calculate the percent from the wrong starting price.
How to Assess It
- Exit ticket: A shop's price table lists (0 pens, $0), (2 pens, $5), and (4 pens, $10). Decide whether the table is proportional, explain why, write an equation, and find the cost of 7 pens.
Lesson moves
Ways to Teach It
Use red and blue counters to build 3:2, 6:4, and 9:6 batches, then record and graph red versus blue counts.
Show two tables: (2,5), (4,10) and (2,5), (4,11). Ask students which shows a proportional relationship and why.
Make three cards: y = 3x, a table with (1,3) and (2,6), and y = 2x; partners match equal rates.
Compare a $30 jacket at 20% off with a $25 jacket at 10% off; students calculate both final prices.
Free download
Printable 7.A.2 Worksheet
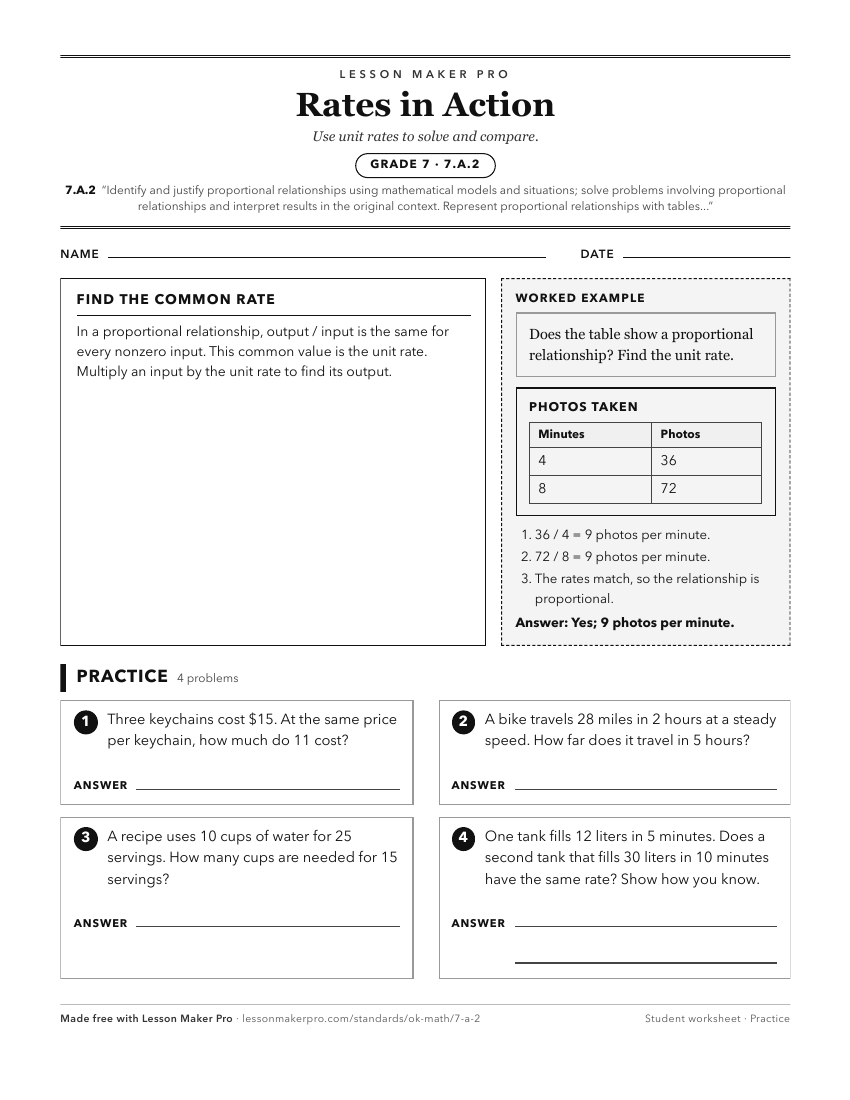
A ready-to-print activity worksheet aligned to 7.A.2, with an answer key for the teacher on its own page. No account needed.
PDF, US Letter, prints cleanly in black and white.
Download the worksheetKeep exploring
Related Standards
- PA.A.2
Identify and justify linear functions using mathematical models and situations; solve problems involving linear functions and interpret results in the original ...
- 7.A.1
Explain the concept of proportionality in mathematical models and situations and distinguish between proportional and non-proportional relationships.
- 7.D.2
Calculate and use proportional reasoning with probabilities to model and solve mathematical problems.
- 7.GM.3
Use mathematical models and reasoning with proportions and ratios to determine measurements, justify formulas, and solve problems.
Turn this cluster into a lesson
Grade, subject, topic, and the complete cluster are prefilled. Create one free, no account needed.
Also for this cluster:Make a WorksheetMake a QuizMake a Sub Lesson