NY Next Generation Math NY-7.RP.2
Standard Cluster
Recognize and represent proportional relationships between quantities.
New York State Next Generation Mathematics Learning Standards
Cluster contents
Standards in This Cluster
NY-7.RP.2 is a cluster heading. These are the individual standards under it.
- NY-7.RP.2.a
Decide whether two quantities are in a proportional relationship.
- NY-7.RP.2.b
Identify the constant of proportionality (unit rate) in tables, graphs, equations, diagrams, and verbal descriptions of proportional relationships.
- NY-7.RP.2.c
Represent a proportional relationship using an equation.
- NY-7.RP.2.d
Explain what a point (x, y) on the graph of a proportional relationship means in terms of the situation, with special attention to the points (0, 0) and (1, r) ...
Teacher's field guide
What This Cluster Means
What Students Need to Do
- Students decide whether two quantities are proportional using tables, graphs, equations, diagrams, or descriptions. They identify the constant of proportionality, write an equation, and explain points on the graph in context.
What Mastery Looks Like
- From a table containing (2, 6) and (5, 15), a student identifies a constant of proportionality of 3 and writes y = 3x. The student explains (0, 0) and (1, 3) in the situation.
Common Misconceptions
- Students may call any increasing relationship proportional or accept a straight line that does not pass through the origin. They may divide in the wrong order or confuse a coordinate with the unit rate.
How to Assess It
- A store charges $4 per notebook, giving the pairs (1, 4), (2, 8), and (5, 20), where x is notebooks and y is dollars. Ask whether the relationship is proportional, then request the constant, equation, and meaning of (1, 4).
Lesson moves
Ways to Teach It
Build equivalent ratios with linking cubes, record the pairs in a table, and graph them to check for a line through the origin.
Ask students why a straight graph with a nonzero vertical intercept does not show a proportional relationship.
Match tables, graphs, equations, and descriptions that share one constant of proportionality, then justify every set.
Compare a per-item price with a taxi fare that includes a starting fee and decide which relationship is proportional.
Free download
Printable NY-7.RP.2 Worksheet
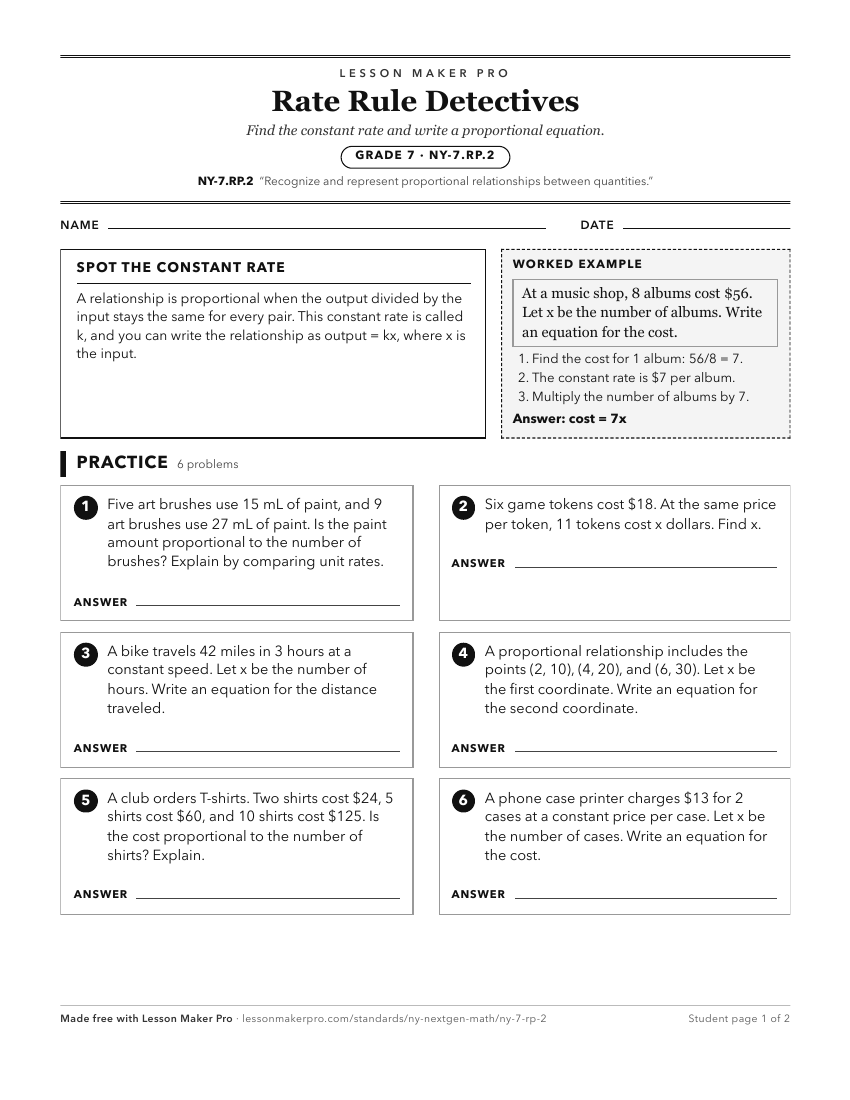
A ready-to-print activity worksheet aligned to NY-7.RP.2, with an answer key for the teacher on its own page. No account needed.
PDF, US Letter, prints cleanly in black and white.
Download the worksheetTurn this cluster into a lesson
Grade, subject, topic, and the complete cluster are prefilled. Create one free, no account needed.
Also for this cluster:Make a WorksheetMake a QuizMake a Sub Lesson