Montana Math MT.PLUS.ALG.MOD.1.a
The Standard
- MT.PLUS.ALG.MOD.1
- Model situations in context with polynomial, exponential, logarithmic, and trigonometric functions. This standard should incorporate cultural context relating to Montana Indigenous Peoples and local communities by: Determining if a set of data is best modeled by a polynomial, exponential, logarithmic, or trigonometric function or none, and explaining why, and Understanding that there are contexts where solutions may not lie on the curve.
Model situations in context with polynomial, exponential, logarithmic, and trigonometric functions. This standard should incorporate cultural context relating to Montana Indigenous Peoples and local communities by: Determining if a set of data is best modeled by a polynomial, exponential, logarithmic, or trigonometric function or none, and explaining why, and
2026 Montana Mathematics Content Standards · Algebraic and Functional Reasoning
Teacher's field guide
What This Standard Means
What Students Need to Do
- Students graph data from a real setting and choose a polynomial, exponential, logarithmic, or trigonometric model, or none. They explain the pattern and decide whether the model makes sense for that setting.
What Mastery Looks Like
- Students use differences, ratios, slowing growth, or repeating peaks to support their choice. They check predictions against the data and can explain why a model that fits a few points may still be a poor choice.
Common Misconceptions
- Students may call every rising curve exponential, even when growth slows down. They may choose a polynomial just because it passes through the given points. They may extend a short-term fit far beyond the data.
How to Assess It
- Exit ticket: Browning's daylight hours in January, April, July, and October are about 9, 14, 16, and 11, and the pattern repeats yearly. Choose a model and explain why an exponential model would be a poor choice.
Lesson moves
Ways to Teach It
On graph paper, plot printed tables of square numbers, doubling counts, sound intensity and decibels, Browning daylight hours, and random readings; sort models.
Write two sentences: What does Browning daylight data show, and why can't it predict dates of Blackfeet community events?
Match five plotted graphs to cards labeled constant second differences, constant ratios, slowing growth, repeating peaks, and no clear pattern; defend each match.
Use a Browning daylight table to predict next June's daylight, then check the estimate against a published sunrise and sunset table.
Free download
Printable MT.PLUS.ALG.MOD.1.a Worksheet
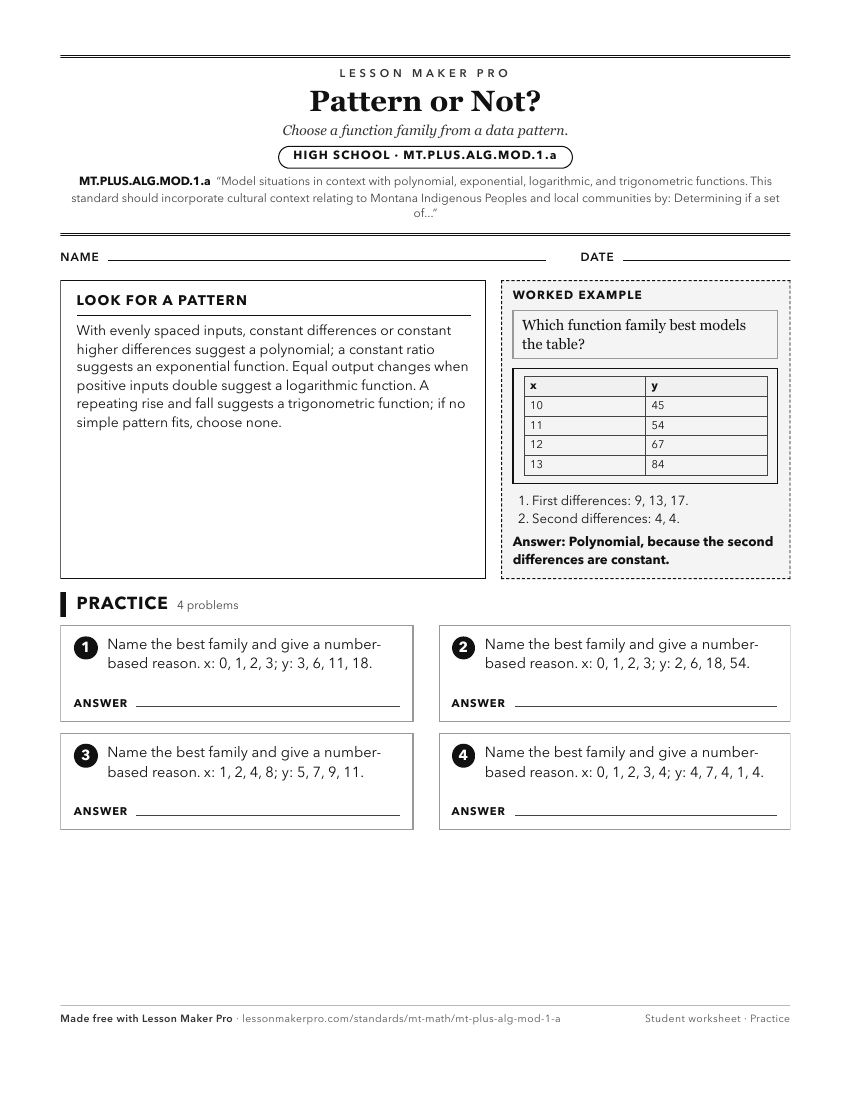
A ready-to-print activity worksheet aligned to MT.PLUS.ALG.MOD.1.a, with an answer key for the teacher on its own page. No account needed.
PDF, US Letter, prints cleanly in black and white.
Download the worksheetKeep exploring
Related Standards
- MT.PLUS.ALG.MOD.1
Model situations in context with polynomial, exponential, logarithmic, and trigonometric functions. This standard should incorporate cultural context relating t...
- MT.PLUS.ALG.EXP.4
Graph logarithmic and exponential functions with and without the use of technology by identifying intercepts, asymptotes, and end behavior.
- MT.CORE.ALG.MOD.1.a
Determining if a set of data is best modeled by a linear function, quadratic function, exponential function, or none, and explaining why, and
- MT.CORE.ALG.MOD.1
Model situations in context, with linear, quadratic, and exponential functions. This standard should incorporate cultural context relating to Montana Indigenous...
Turn this exact standard into a lesson
Grade, subject, topic, and the complete standard are prefilled. Create one free, no account needed.
Also for this standard:Make a WorksheetMake a QuizMake a Sub Lesson