Montana Math MT.CORE.DATA.LIT.1
The Standard
Distinguish between quantitative and categorical data and use representations and analysis techniques that are appropriate for each type.
2026 Montana Mathematics Content Standards · Data Reasoning and Probability
Teacher's field guide
What This Standard Means
What Students Need to Do
- Students decide whether data values are amounts or labels, even when labels use numbers. They choose a graph and summary that fit each kind of data.
What Mastery Looks Like
- Given commute times, travel modes, and locker numbers, students identify times as quantitative and the other two as categorical. They use a dot plot and median for times, and a bar chart and counts for travel modes.
Common Misconceptions
- Students may treat locker numbers as amounts because they contain digits. They may calculate an average travel mode or use a histogram for named groups.
How to Assess It
- Exit ticket: A survey records commute minutes and travel mode. Name each data type, choose a graph and summary for each, and explain why averaging travel modes would not work.
Lesson moves
Ways to Teach It
Have students write their commute time and travel mode on sticky notes, then build a dot plot for times and a bar chart for modes.
Ask: Why can we find the median commute time but not the median travel mode? Have students defend their answers in two sentences.
Play a card match with variables, graphs, and summaries, including jersey number; students explain why each match fits.
Give students a mock grocery receipt with item prices and food categories; have them draw a price dot plot and category bar chart.
Free download
Printable MT.CORE.DATA.LIT.1 Worksheet
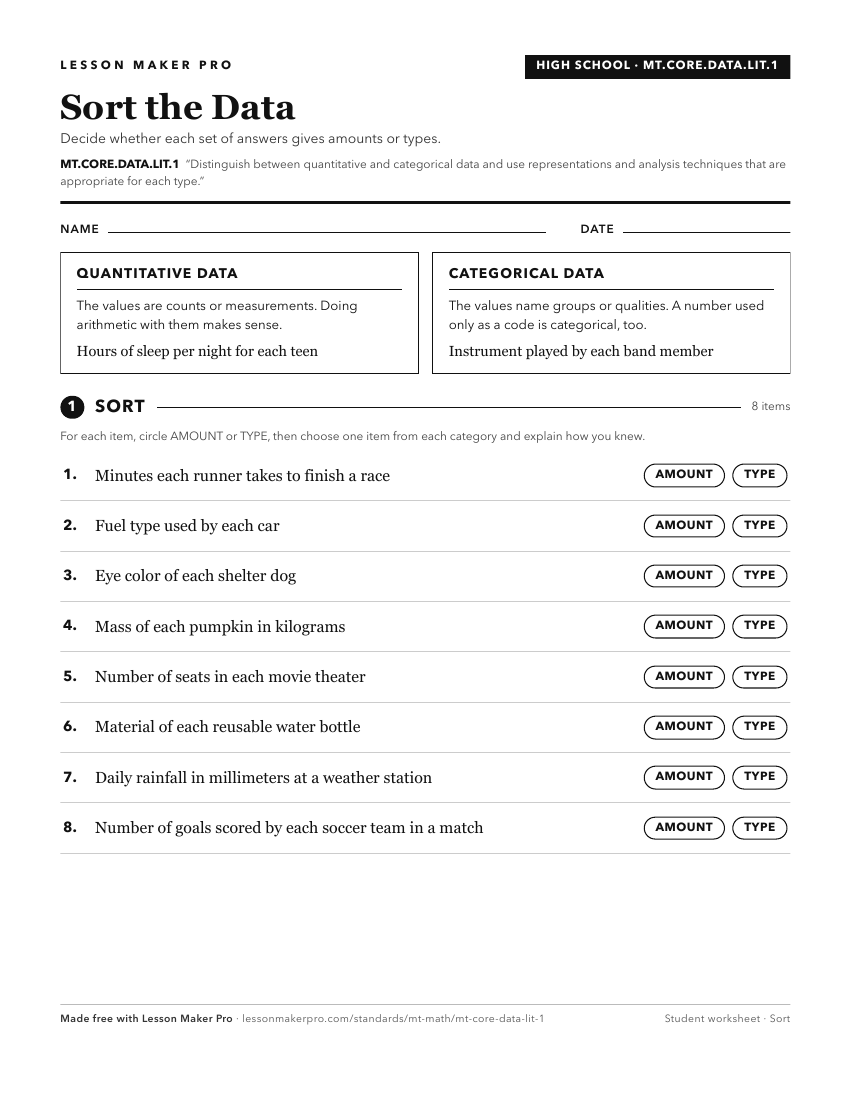
A ready-to-print activity worksheet aligned to MT.CORE.DATA.LIT.1, with an answer key for the teacher on its own page. No account needed.
PDF, US Letter, prints cleanly in black and white.
Download the worksheetKeep exploring
Related Standards
- MT.CORE.DATA.INT.6.a
Using technology strategically, represent two quantitative data distributions on scatter plots,
- MT.CORE.DATA.INT.7.a
Summarizing categorical data for two categories in two-way frequency tables and visual representations,
- MT.1.MD.5
Organize, represent, and interpret data with up to three categories by: Asking and answering questions about the total number of data points, Identifying how ma...
- MT.6.SP.5
Characterize numerical data sets from a sample in relation to their context, such as by: Reporting the number of observations, Describing the nature of the attr...
Turn this exact standard into a lesson
Grade, subject, topic, and the complete standard are prefilled. Create one free, no account needed.
Also for this standard:Make a WorksheetMake a QuizMake a Sub Lesson