Montana Math MT.8.F.2
The Standard
Compare properties of two functions using tables, graphs, and equations.
2026 Montana Mathematics Content Standards
Teacher's field guide
What This Standard Means
What Students Need to Do
- Students use tables, graphs, and equations to compare two functions at the same input. For straight-line functions, they also compare starting values and how much the output changes each step.
What Mastery Looks Like
- A student can use a graph and a table to show which function has the greater output at x = 2. They can compare starting values and rates of change when one function is given as an equation.
Common Misconceptions
- Students may compare outputs from different inputs or assume the function that starts higher always stays higher. Some mistake a value in a table for the rate of change instead of finding the difference between rows.
How to Assess It
- Give students the table (0, 3), (1, 5), (2, 7) and the equation y = 3x + 1. Ask which starts higher and which grows faster, with evidence for each answer.
Lesson moves
Ways to Teach It
Give pairs graph paper and the table (0, 3), (1, 5), (2, 7); have them plot it alongside y = 3x + 1 and circle the crossing.
Ask, 'Which line starts higher, and which rises faster?' Have students point to evidence on the graphs they drew.
Give students cards with equations, tables, and graphs for two lines; have them match each set, then compare the lines at x = 3.
Post bike rental signs: A charges $3 plus $2 per hour, B charges $1 plus $3 per hour; students find when costs match.
Free download
Printable MT.8.F.2 Worksheet
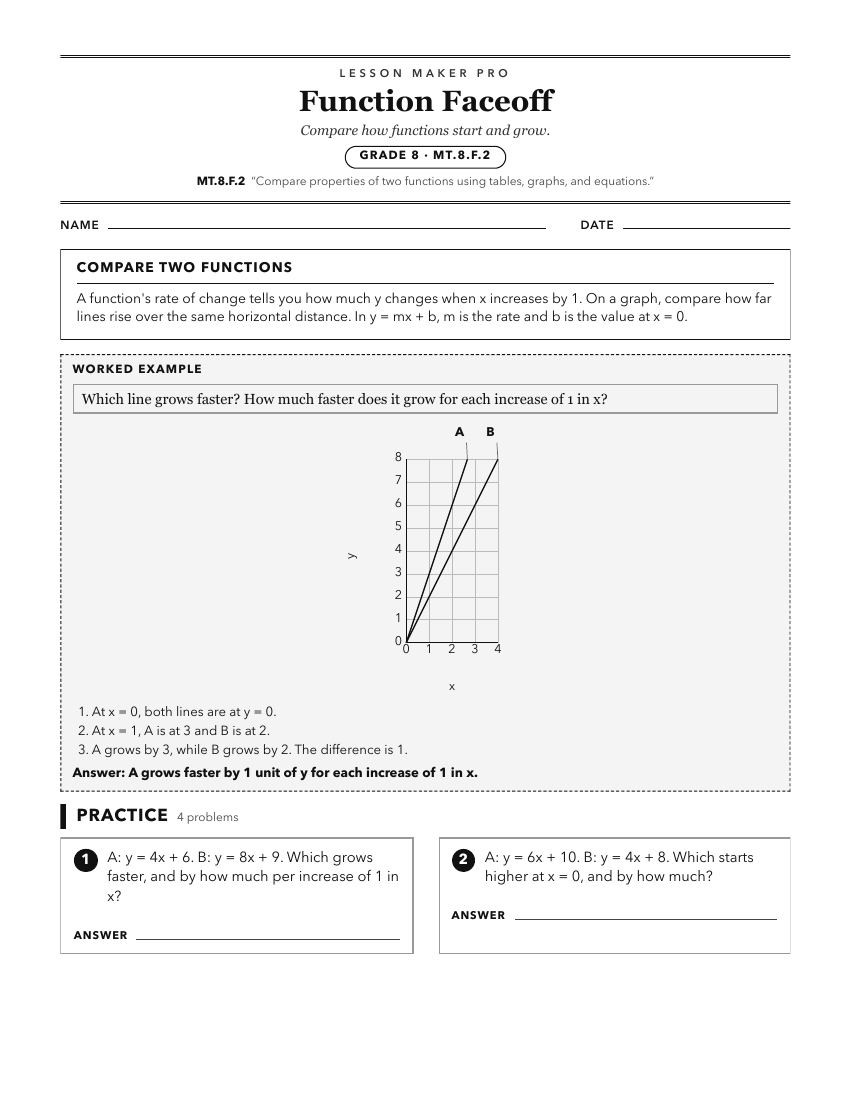
A ready-to-print activity worksheet aligned to MT.8.F.2, with an answer key for the teacher on its own page. No account needed.
PDF, US Letter, prints cleanly in black and white.
Download the worksheetKeep exploring
Related Standards
- MT.6.EE.3
Apply the properties of operations including the distributive property, to generate equivalent expressions and determine when two expressions are equivalent.
- MT.8.EE.5
Graph proportional relationships, interpret the unit rate as the slope of the graph, and compare two different proportional relationships as tables, graphs, and...
- MT.7.RP.2
Recognize and represent proportional relationships between quantities, using tables, graphs, and equations by: Deciding whether a table represents quantities in...
Turn this exact standard into a lesson
Grade, subject, topic, and the complete standard are prefilled. Create one free, no account needed.
Also for this standard:Make a WorksheetMake a QuizMake a Sub Lesson