Montana Math MT.7.RP.2
The Standard
Recognize and represent proportional relationships between quantities, using tables, graphs, and equations by: Deciding whether a table represents quantities in a proportional relationship, by testing for equivalent ratios and deciding whether a graph represents quantities in a proportional relationship if the graph is a straight line through the origin, and Identifying the constant of proportionality (unit rate) in tables, graphs, and equations, of proportional relationships.
2026 Montana Mathematics Content Standards
Teacher's field guide
What This Standard Means
What Students Need to Do
- Students find the amount for one unit from pairs of values. They check whether that rate stays the same across a table or graph, then write an equation.
What Mastery Looks Like
- Given (1, 4), (2, 8), and (3, 12), a student finds 4 dollars per item, graphs the points from (0, 0), and writes y = 4x. They can explain why adding a $3 starting fee changes the relationship.
Common Misconceptions
- Students may check for equal increases in a table but forget to check the rate for each pair. They may also think any straight line works, even one that crosses the y-axis at 3.
How to Assess It
- Exit ticket: A table shows (hours, dollars) as (1, 5), (2, 10), and (3, 15). Ask students whether the relationship is proportional, what it costs per hour, what equation fits, and where its graph crosses the y-axis.
Lesson moves
Ways to Teach It
Have students put 3 counters in each cup, record totals for 1 through 4 cups, and graph the results.
Show graphs of y = 4x and y = 4x + 3; ask which shows a fixed price per item and why.
Partners sort cards A: (1,4), (2,8), (3,12) and B: (1,6), (2,10), (3,14), then explain which has a constant rate.
Compare grocery prices of 2 pounds for $6 and 5 pounds for $15; plot both and find the price per pound.
Free download
Printable MT.7.RP.2 Worksheet
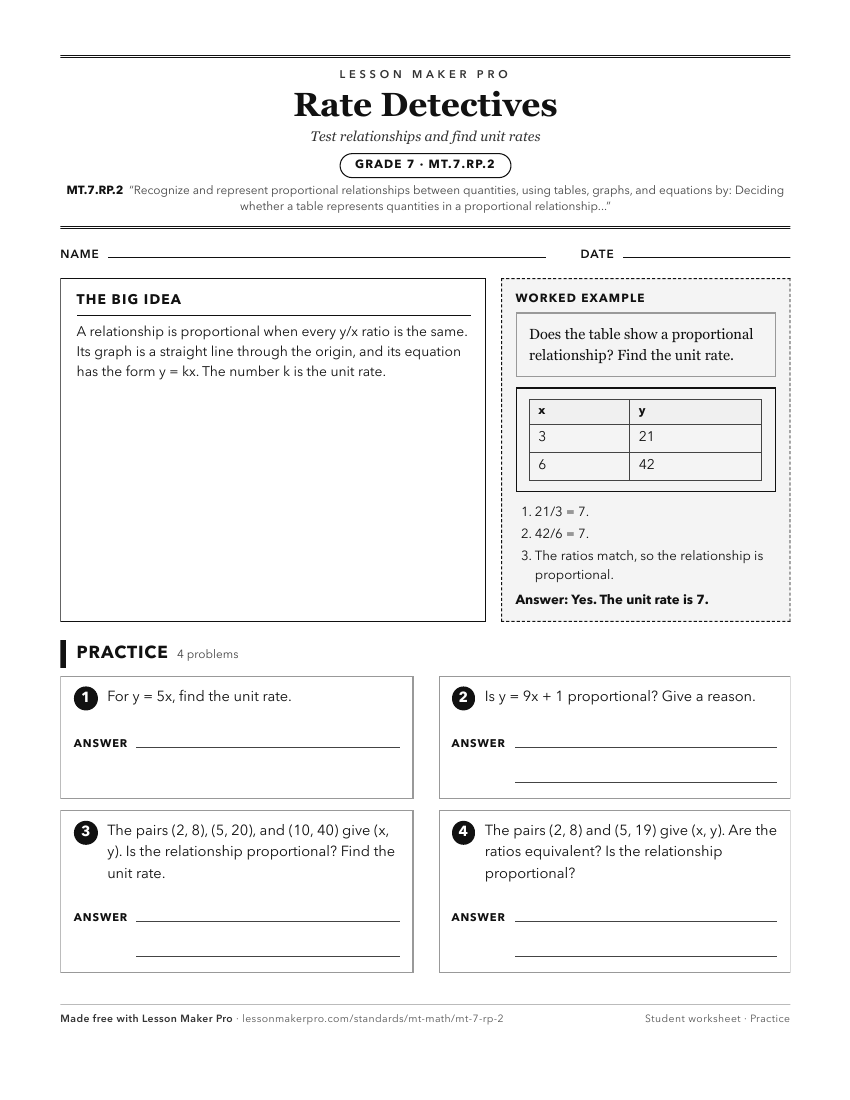
A ready-to-print activity worksheet aligned to MT.7.RP.2, with an answer key for the teacher on its own page. No account needed.
PDF, US Letter, prints cleanly in black and white.
Download the worksheetKeep exploring
Related Standards
- MT.7.RP.3
Use proportional relationships to solve multi-step ratio and percent problems, including problems in context that involve simple interest, tax, markups and mark...
- MT.6.RP.3
Use ratio and rate reasoning to solve proportional problems in context about unit rates, percentages (as a rate per 100), and/or measurement units using tables ...
- MT.8.EE.5
Graph proportional relationships, interpret the unit rate as the slope of the graph, and compare two different proportional relationships as tables, graphs, and...
Turn this exact standard into a lesson
Grade, subject, topic, and the complete standard are prefilled. Create one free, no account needed.
Also for this standard:Make a WorksheetMake a QuizMake a Sub Lesson