Mississippi Science BIO.3C.3
The Standard
- BIO.3C
- Students will construct an explanation based on evidence to describe how the structure and nucleotide base sequence of DNA determines the structure of proteins or RNA that carry out essential functions of life.
Use models to predict how various changes in the nucleotide sequence (e.g., point mutations, and frameshift mutations) will affect the resulting protein product and the subsequent inherited trait.
2026 Mississippi College- and Career-Readiness Standards for Science · Reproduction and Heredity
Teacher's field guide
What This Standard Means
What Students Need to Do
- Students change, add, or remove a base in a DNA sequence. They track the resulting amino acids, then use a protein-function model to predict a possible trait change. They distinguish inherited changes from changes that occur only in body cells.
What Mastery Looks Like
- Given a coding DNA sequence and a codon chart, students translate the original and changed sequences. They can spot a substitution that leaves the amino acid unchanged and an insertion that shifts the reading frame. They use a protein-function key to predict a trait, without assuming every mutation changes it.
Common Misconceptions
- Students often think every base change alters an amino acid, or that an insertion affects only one codon. Some assume any changed protein changes a visible trait, or that a mutation in a skin cell can pass to a child.
How to Assess It
- Exit ticket: A pigment enzyme uses coding DNA ATG GAA TTT TAA; compare GAA→GAG with an A inserted after ATG using a codon chart. List the resulting amino acids, predict whether pigment might change, and explain whether either change could be inherited if it occurs in a sperm cell.
Lesson moves
Ways to Teach It
Give pairs letter tiles for ATG GAA TTT TAA; have them swap or add one tile, regroup codons, and translate with a chart.
Ask students to write: Why might GAA to GAG leave a trait unchanged, while inserting A after ATG may not?
Play mutation match: deal DNA change cards and protein result cards, then have teams pair them using a codon chart.
Show images of normal and sickled red blood cells, then have students trace the hemoglobin GAG to GTG change using a codon chart.
Free download
Printable BIO.3C.3 Worksheet
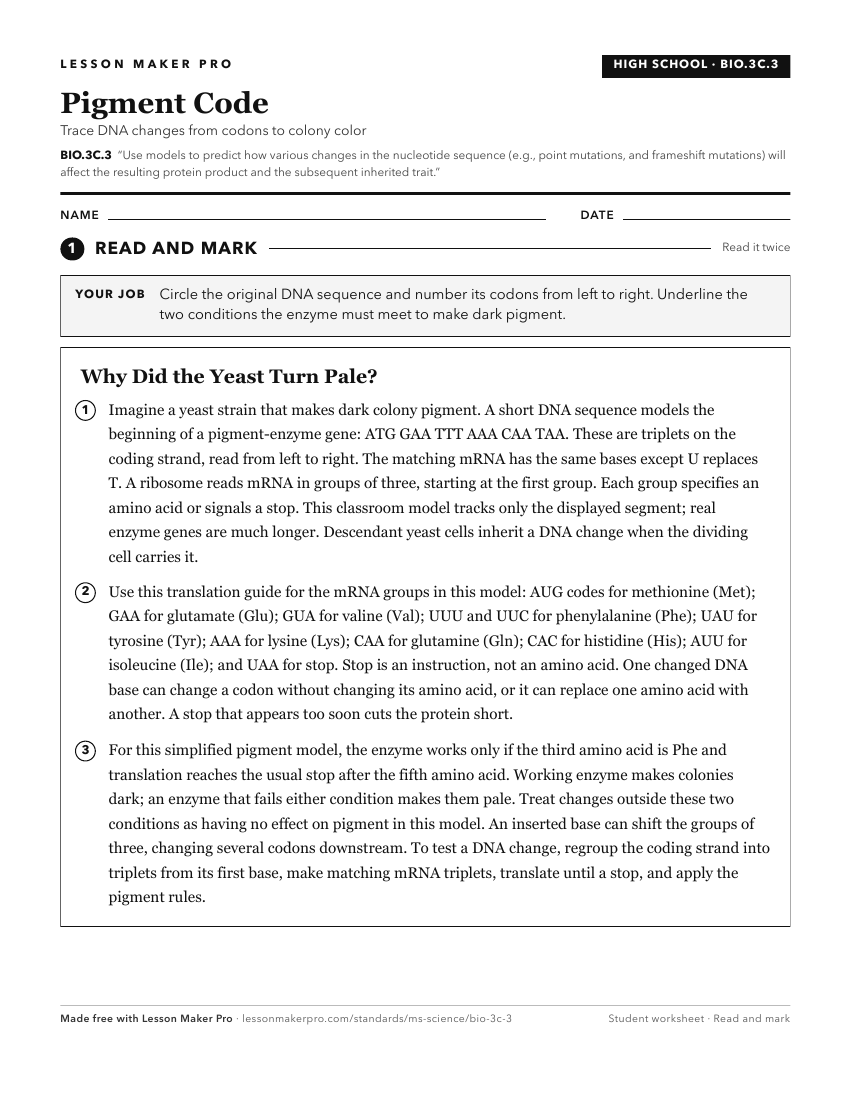
A ready-to-print activity worksheet aligned to BIO.3C.3, with an answer key for the teacher on its own page. No account needed.
PDF, US Letter, prints cleanly in black and white.
Download the worksheetKeep exploring
Related Standards
- BIO.3C.1
Develop and use models to explain the relationship between DNA, genes, and chromosomes in coding the instructions for the traits transferred from parent to offs...
- L.8.2A.1
Use a model to show the relationship of genes, chromosomes, and DNA, and construct explanations comparing their relationship to inherited characteristics.
- FB.4.3
Use models (e.g., Punnett squares) and mathematical reasoning to describe and predict patterns of inheritance of single genetic traits from parents to offspring...
- FB.4.4
Obtain and communicate information to describe how mutations may affect genetic expression and provide examples.
Turn this exact standard into a lesson
Grade, subject, topic, and the complete standard are prefilled. Create one free, no account needed.
Also for this standard:Make a WorksheetMake a QuizMake a Sub Lesson