Mississippi Math FA.S.44
The Standard
Justify the relationship between the correlation coefficient and the rate of change for the line of best fit.
2025 Mississippi College- and Career-Readiness Standards for Mathematics
Teacher's field guide
What This Standard Means
What Students Need to Do
- Students explain why the correlation coefficient and the slope of a best-fit line have the same sign. They use the spread of the x-values and y-values to explain why the two numbers are usually different.
What Mastery Looks Like
- Given r = 0.8, an x standard deviation of 2, and a y standard deviation of 10, a student finds a slope of 4. They explain that multiplying every y-value by 10 multiplies the slope by 10 but leaves r unchanged.
Common Misconceptions
- Students may use r as the slope or assume a steeper line means a stronger correlation. They may also think changing units changes r, even though it changes the slope.
How to Assess It
- Exit ticket: A data set has r = 0.6, an x standard deviation of 2, and a y standard deviation of 10. Find the slope, then explain what happens to the slope and r if every y-value doubles.
Lesson moves
Ways to Teach It
Enter (1,2), (2,4), (3,5), (4,7), and (5,9) in a spreadsheet, graph them, then multiply every y-value by 10 and compare slopes and r.
Ask: If two data sets both have r = 0.8, must their best-fit lines have equal slopes? Explain using the spreads of x and y.
Hand out cards showing r and the x and y standard deviations; students calculate each slope and match it to a slope card.
Compare weekly training miles with race time, then convert miles to kilometers and explain why r stays fixed while the slope changes.
Free download
Printable FA.S.44 Worksheet
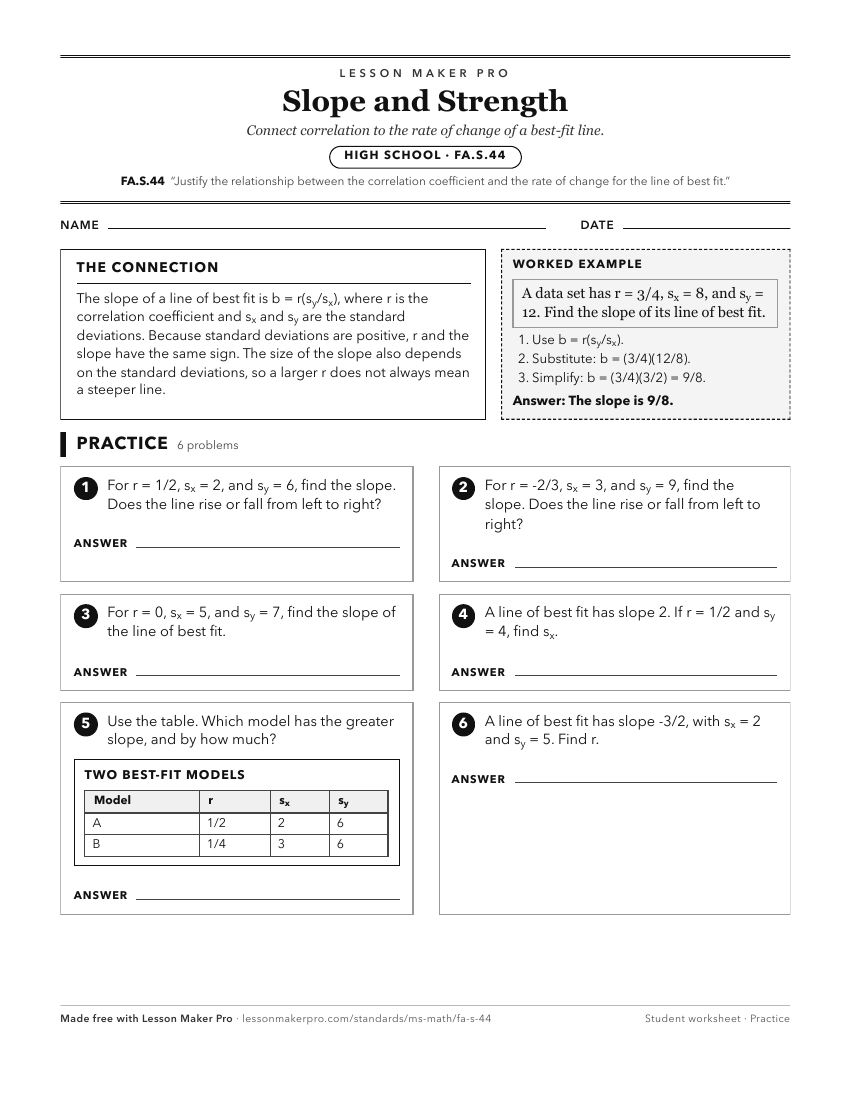
A ready-to-print activity worksheet aligned to FA.S.44, with an answer key for the teacher on its own page. No account needed.
PDF, US Letter, prints cleanly in black and white.
Download the worksheetKeep exploring
Related Standards
- FA.S.43
For scatter plots that suggest a linear association, informally fit a straight line and predict the equation for the line of best fit. (8.SP.2)
- FA.F.15
Determine the rate of change of a linear function from a description of a relationship or from two (x, y) values, including reading these from a table or from a...
Turn this exact standard into a lesson
Grade, subject, topic, and the complete standard are prefilled. Create one free, no account needed.
Also for this standard:Make a WorksheetMake a QuizMake a Sub Lesson