Mississippi Math FA.F.15
The Standard
Determine the rate of change of a linear function from a description of a relationship or from two (x, y) values, including reading these from a table or from a graph. (8.F.4) Use the rate of change to determine if two lines are parallel, perpendicular, or neither.
2025 Mississippi College- and Career-Readiness Standards for Mathematics
Teacher's field guide
What This Standard Means
What Students Need to Do
- Students find a line's slope from a story, two points, a table, or a graph. They compare slopes to decide whether two lines are parallel, perpendicular, or neither.
What Mastery Looks Like
- Students calculate slope by dividing the change in y by the change in x. They know parallel lines have equal slopes and different intercepts. For perpendicular lines, they use negative reciprocal slopes, or recognize a horizontal and vertical pair.
Common Misconceptions
- Students may divide the change in x by the change in y, or subtract coordinates in different orders. Some think slopes of 2 and -2 are perpendicular. Others give a vertical line a slope of zero instead of undefined.
How to Assess It
- Exit ticket: A line passes through (1, 2) and (3, 6). Is it parallel, perpendicular, or neither to y = -1/2x + 4? Show both slopes.
Lesson moves
Ways to Teach It
Plot (1, 2) and (3, 6) on graph paper, count rise and run, then draw a perpendicular line through (1, 2).
Ask: Two tables both show y increasing by 3 when x increases by 1. Must they show the same line? Explain.
Hand out cards showing equations and tables; students sort line pairs as parallel, perpendicular, or neither and explain their choices.
Show a ramp rising 1 foot over 12 feet; students calculate its slope and sketch a parallel ramp on graph paper.
Free download
Printable FA.F.15 Worksheet
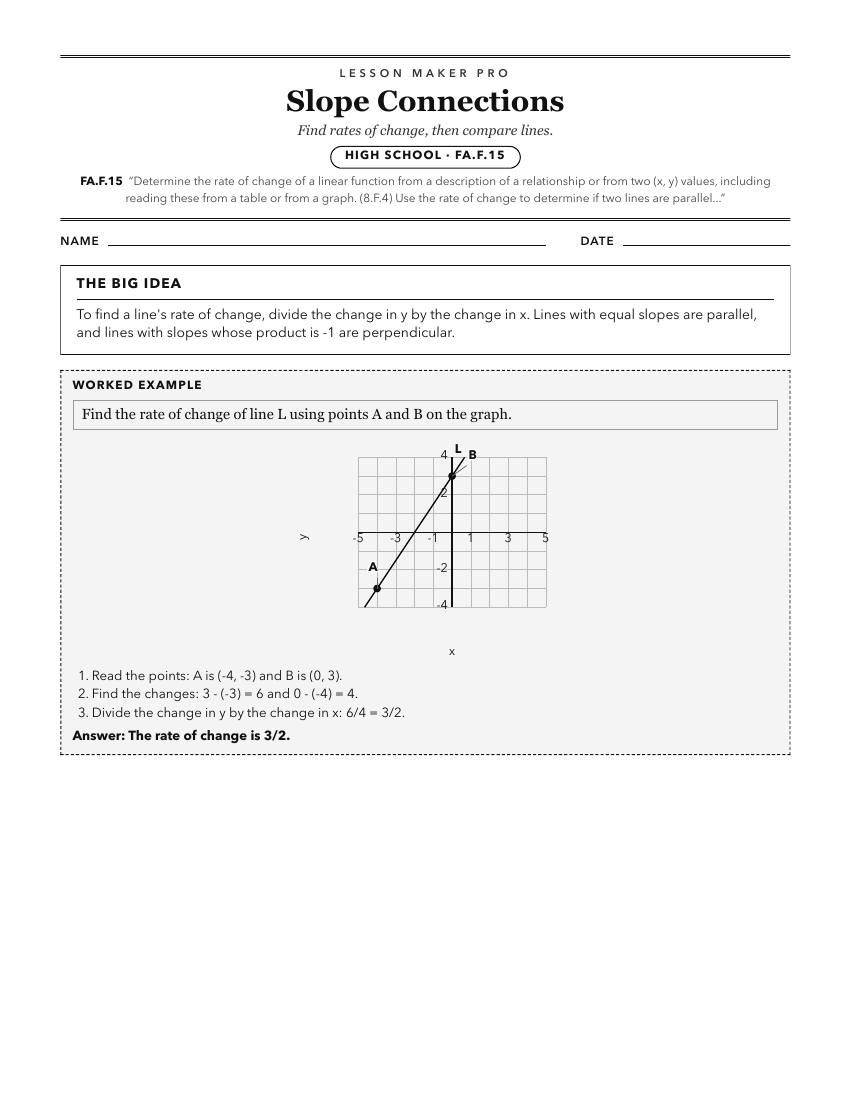
A ready-to-print activity worksheet aligned to FA.F.15, with an answer key for the teacher on its own page. No account needed.
PDF, US Letter, prints cleanly in black and white.
Download the worksheetKeep exploring
Related Standards
- FA.F.16
Interpret the rate of change and initial value of a linear function in terms of the situation it models, and in terms of its graph or a table of values. (8.F.4)
- FA.F.20
Compare the properties of two functions, each represented in a different way (algebraically, graphically, numerically in tables, or by verbal descriptions). For...
Turn this exact standard into a lesson
Grade, subject, topic, and the complete standard are prefilled. Create one free, no account needed.
Also for this standard:Make a WorksheetMake a QuizMake a Sub Lesson