Maryland Math 8.DS.A.1
Standard Cluster
Evaluate predictions and conclusions drawn from bivariate data. Determine whether observed associations in sample data justify generalizations about a broader population. Identify limitations or potential bias in data collection or interpretation when analyzing trends in scatter plots.
Maryland College and Career Ready Standards for Mathematics (2025) · MAKE SENSE OF STATISTICAL INQUIRY. NEW CLUSTER
Cluster contents
Standards in This Cluster
8.DS.A.1 is a cluster heading. These are the individual standards under it.
Teacher's field guide
What This Cluster Means
What Students Need to Do
- Students describe patterns in scatter plots that show two measures. They decide whether a sample supports a claim about a larger group. They check how the data were collected and consider other explanations for a trend.
What Mastery Looks Like
- Given a scatter plot from one class, a student describes the trend without saying one measure caused the other. They explain why that class may not represent the whole school.
Common Misconceptions
- Students may treat a trend as proof that one variable causes the other. They may assume one homeroom represents all eighth graders or overlook people who did not answer a survey.
How to Assess It
- Exit ticket: Plot these six volunteers' (phone hours, sleep hours): (1, 9), (2, 8), (3, 8), (4, 7), (5, 7), (6, 6). Does the plot justify claiming that phone use causes less sleep for all eighth graders? Explain one limit.
Lesson moves
Ways to Teach It
Give groups six index cards with paired phone and sleep hours; have them plot the points and decide whether six volunteers represent their grade.
Ask, 'Six volunteers who use phones more sleep less. Does that mean phones cause lost sleep? What else could explain the pattern?'
Teams sort three claim cards about the volunteer plot: 'linked in this sample,' 'true for all teens,' and 'phones cause lost sleep.'
Show a mock social media post using the six-volunteer plot to claim phones ruin sleep for all teens; students write a corrected caption.
Free download
Printable 8.DS.A.1 Worksheet
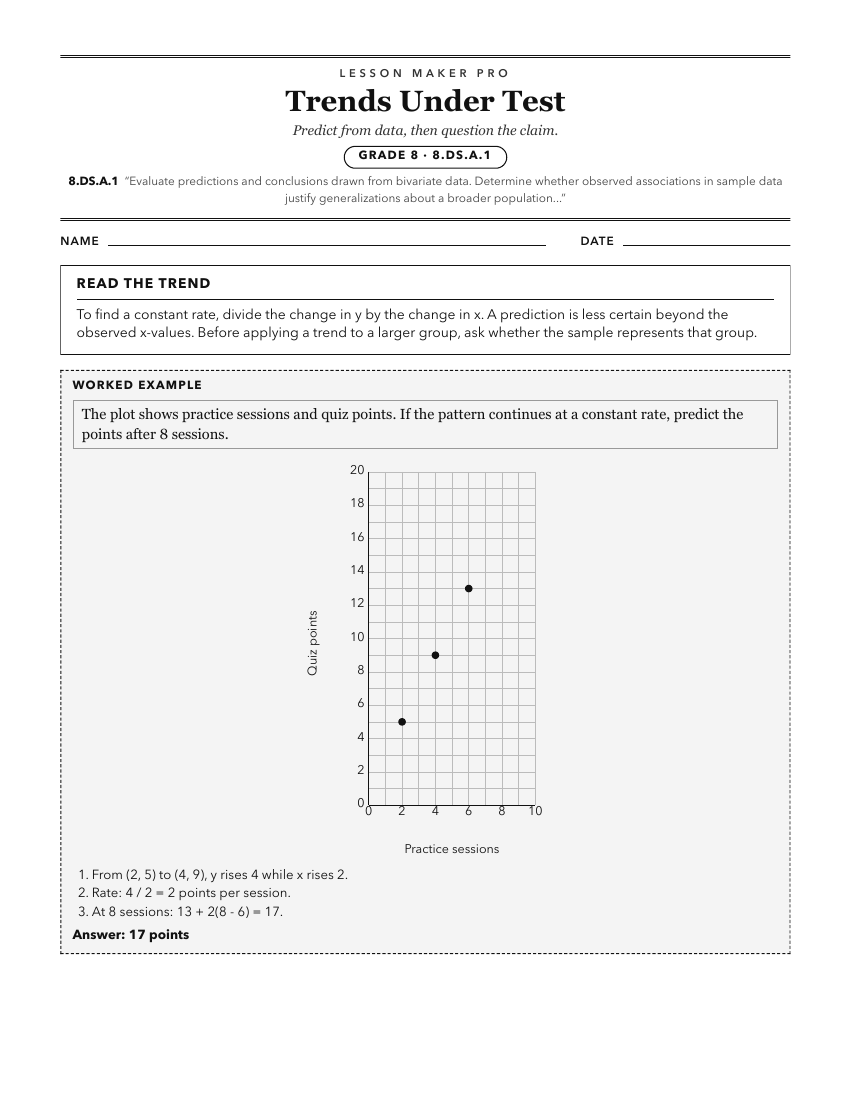
A ready-to-print activity worksheet aligned to 8.DS.A.1, with an answer key for the teacher on its own page. No account needed.
PDF, US Letter, prints cleanly in black and white.
Download the worksheetKeep exploring
Related Standards
- 4.DS.A.1.b
Summarize data presented in scaled data visualizations (e.g. bar graphs, line plots) and draw conclusions about the data.
- 7.DS.C.6.c
Compare probabilities from a model to observed data and explain possible reasons for any differences.
- 8.DS.B.4
Use a provided linear model to make predictions based on bivariate measurement data. Interpret the meaning of the slope and y-intercept in context.
Turn this cluster into a lesson
Grade, subject, topic, and the complete cluster are prefilled. Create one free, no account needed.
Also for this cluster:Make a WorksheetMake a QuizMake a Sub Lesson