Maryland Math 6.DS.B.6.c
The Standard
- 6.DS.B.6
- Summarize numerical data sets in relation to their context.
Give quantitative measures of center (median and/or mean) and variability (interquartile range), as well as describing outliers with reference to the context in which the data were gathered.
Maryland College and Career Ready Standards for Mathematics (2025) · SUMMARIZE AND DESCRIBE DISTRIBUTIONS
Teacher's field guide
What This Standard Means
What Students Need to Do
- Students calculate the mean, median, and interquartile range of a data set. They spot unusually high or low values and explain what those values mean in context.
What Mastery Looks Like
- For reading times of 10, 12, 14, 16, 18, 20, and 50 minutes, a student finds a mean of 20, a median of 16, and an interquartile range of 8 minutes. They explain that one student's 50-minute reading time is unusually high and pulls the mean above the median.
Common Misconceptions
- Students may subtract the smallest value from the largest instead of subtracting the first quartile from the third. They may call a value an outlier without explaining what it represents, or assume it must be a recording error.
How to Assess It
- Exit ticket: Seven students read for 5, 7, 9, 11, 13, 15, and 38 minutes. Find the mean, median, and interquartile range, then identify any outlier and explain what it means.
Lesson moves
Ways to Teach It
Have pairs sort reading-time cards labeled 10, 12, 14, 16, 18, 20, 50, then mark quartiles and calculate the interquartile range.
Ask: Which better describes a typical reading time, the mean or median, when one student read 50 minutes? Explain using both values.
Play a data-match game: pair cards showing seven reading times with cards showing their mean, median, and interquartile range.
Post bus delays of 0, 1, 2, 2, 3, 4, and 16 minutes; ask what the 16-minute delay does to the mean.
Free download
Printable 6.DS.B.6.c Worksheet
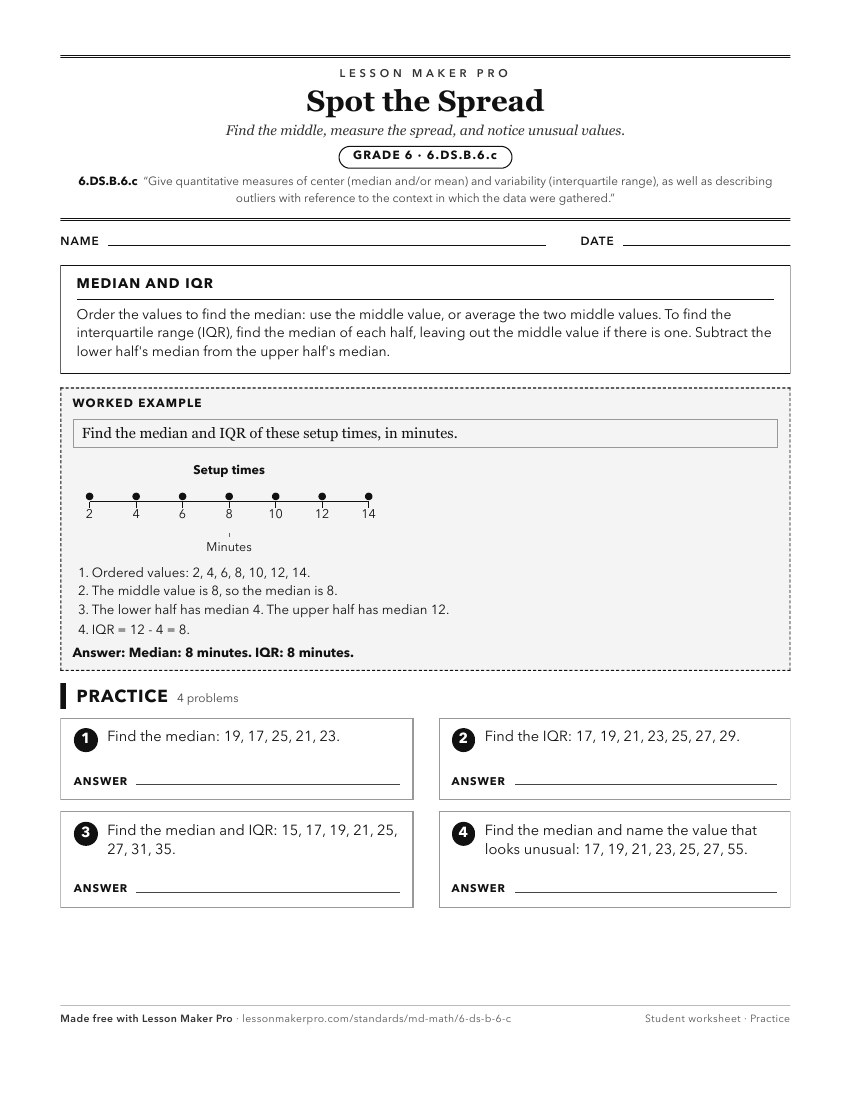
A ready-to-print activity worksheet aligned to 6.DS.B.6.c, with an answer key for the teacher on its own page. No account needed.
PDF, US Letter, prints cleanly in black and white.
Download the worksheetKeep exploring
Related Standards
- 6.DS.A.3
Explain how a set of data collected to answer a statistical question has a distribution which can be described by its center, spread, and overall shape.
- 7.DS.B.3.b
Use measures of center (e.g., mean or median) and measures of variability (e.g., range or interquartile range) to describe the size and significance of the diff...
Turn this exact standard into a lesson
Grade, subject, topic, and the complete standard are prefilled. Create one free, no account needed.
Also for this standard:Make a WorksheetMake a QuizMake a Sub Lesson