Maryland Math 6.DS.A.3
The Standard
Explain how a set of data collected to answer a statistical question has a distribution which can be described by its center, spread, and overall shape.
Maryland College and Career Ready Standards for Mathematics (2025) · EXTEND UNDERSTANDING OF STATISTICAL VARIABILITY
Teacher's field guide
What This Standard Means
What Students Need to Do
- Students display answers to a question that can have different results, often on a dot plot. They describe a typical value, how far the values spread, and where values cluster or thin out.
What Mastery Looks Like
- Given a dot plot, a student can find a center such as the median, state the range, and describe the overall shape. They point to values on the plot to support their description.
Common Misconceptions
- Students may calculate the mean but say nothing about how the values are arranged. They may mistake the range for the number of data points or miss how one high value stretches the plot.
How to Assess It
- Exit ticket: Ten students read 2, 3, 3, 4, 4, 4, 5, 5, 6, and 10 books last month. Draw a dot plot, then describe its center, range, and shape.
Lesson moves
Ways to Teach It
Use sticky notes to plot 2, 3, 3, 4, 4, 4, 5, 5, 6, 10 on a floor number line.
Remove 10 from the sticky-note plot; ask pairs to explain what happens to the median, range, and shape.
Play Plot Match with three dot plots and description cards; pairs match each plot to its stated center, range, and shape.
Tally classmates' travel times to school in minutes, draw a dot plot, and describe the typical time, range, and any clusters.
Free download
Printable 6.DS.A.3 Worksheet
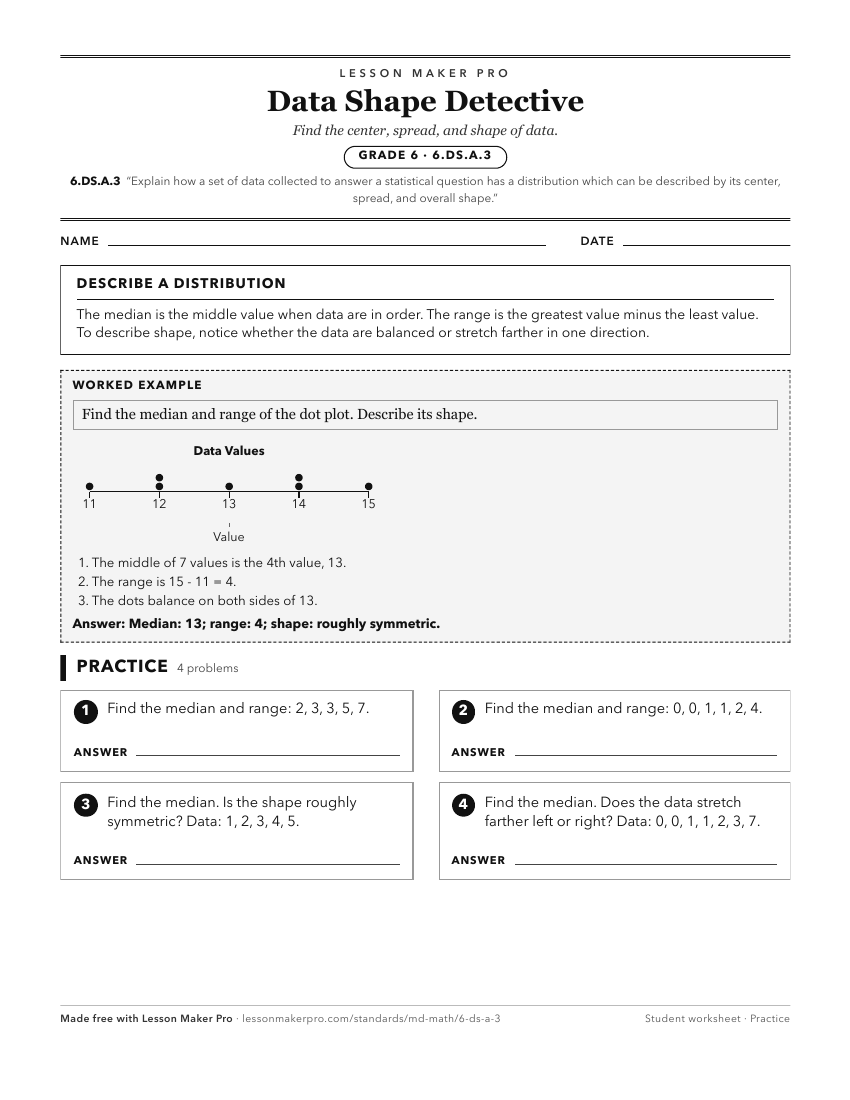
A ready-to-print activity worksheet aligned to 6.DS.A.3, with an answer key for the teacher on its own page. No account needed.
PDF, US Letter, prints cleanly in black and white.
Download the worksheetKeep exploring
Related Standards
- 7.DS.B.3.a
Use histograms and other visualizations to describe similarities and differences in the range, shape, and clustering of the data sets.
- 6.DS.B.6.c
Give quantitative measures of center (median and/or mean) and variability (interquartile range), as well as describing outliers with reference to the context in...
- 7.DS.B.3.b
Use measures of center (e.g., mean or median) and measures of variability (e.g., range or interquartile range) to describe the size and significance of the diff...
Turn this exact standard into a lesson
Grade, subject, topic, and the complete standard are prefilled. Create one free, no account needed.
Also for this standard:Make a WorksheetMake a QuizMake a Sub Lesson