Maryland Math 7.DS.B.3.b
The Standard
- 7.DS.B.3
- Compare two numerical data distributions using visual displays and numerical measures to draw inferences about differences between populations.
Use measures of center (e.g., mean or median) and measures of variability (e.g., range or interquartile range) to describe the size and significance of the difference between the distributions.
Maryland College and Career Ready Standards for Mathematics (2025) · DESCRIBE, ANALYZE, AND COMPARE DATA USING VISUAL AND NUMERICAL REPRESENTATIONS TO MODEL SITUATIONS AND DRAW INFERENCES.
Teacher's field guide
What This Standard Means
What Students Need to Do
- Students find a measure of center and a measure of spread for two data sets, such as the median and IQR. They compare the gap between the centers with the spread to judge how much the groups differ.
What Mastery Looks Like
- Given two lists or box plots, a student finds both medians and IQRs and states the median gap in context. They explain whether the gap stands out compared with the spread and describe any overlap.
Common Misconceptions
- Students may compare medians alone and call a small gap meaningful even when each group varies widely. Others mistake the difference between two groups' highest values for the range, or assume overlapping data means the groups do not differ.
How to Assess It
- Exit ticket: Route A wait times are 8, 9, 10, 11, 12, 13 minutes; Route B times are 10, 11, 12, 13, 14, 15. Find each median and IQR, then explain whether the median gap stands out compared with the spread.
Lesson moves
Ways to Teach It
Hand pairs two color-coded card sets, 4, 5, 6, 7, 8, 9 and 10, 11, 12, 13, 14, 15; sort and find medians and IQRs.
Ask students to explain whether a median gap of four points stands out when both teams have an IQR of 10.
Play Gap or Spread: show median gaps of 2 and 8, both with IQR 5, and have teams justify which stands out.
Show bus wait summaries: Route A median 10.5, IQR 3; Route B median 12.5, IQR 3; choose a route and explain.
Free download
Printable 7.DS.B.3.b Worksheet
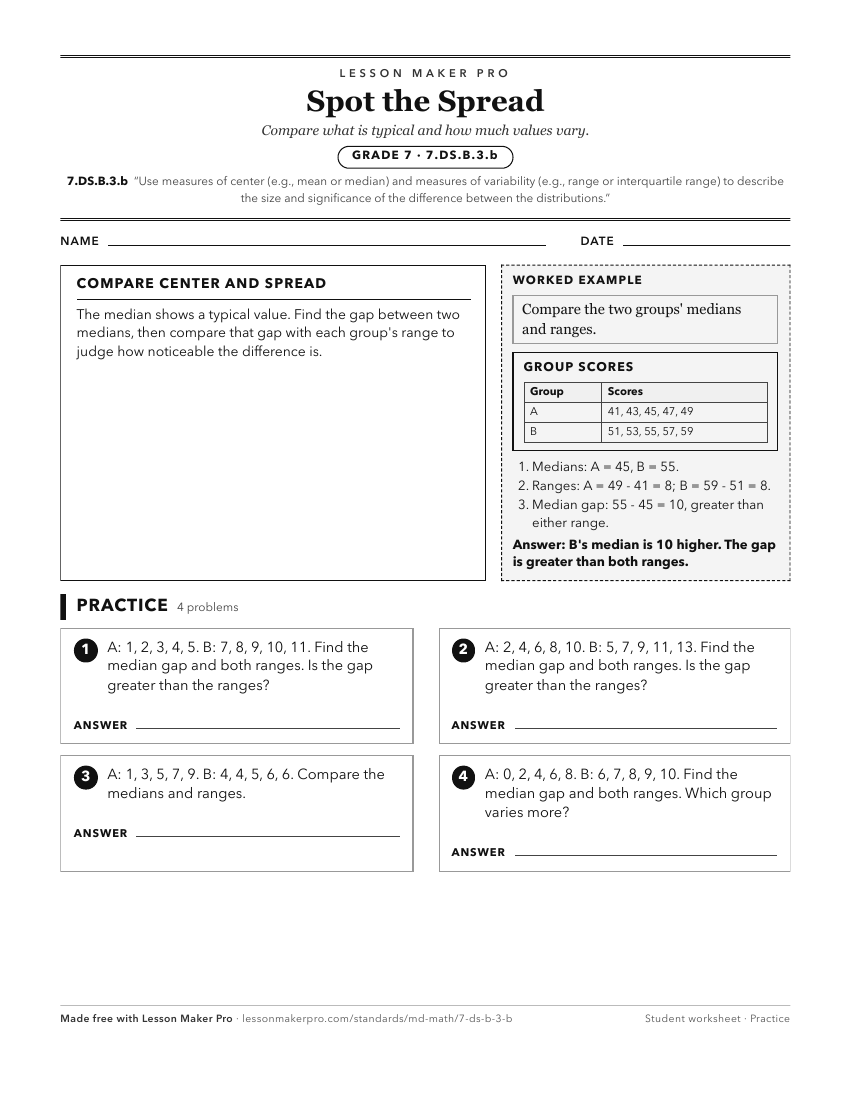
A ready-to-print activity worksheet aligned to 7.DS.B.3.b, with an answer key for the teacher on its own page. No account needed.
PDF, US Letter, prints cleanly in black and white.
Download the worksheetKeep exploring
Related Standards
- 7.DS.B.3
Compare two numerical data distributions using visual displays and numerical measures to draw inferences about differences between populations.
- 6.DS.B.6.c
Give quantitative measures of center (median and/or mean) and variability (interquartile range), as well as describing outliers with reference to the context in...
Turn this exact standard into a lesson
Grade, subject, topic, and the complete standard are prefilled. Create one free, no account needed.
Also for this standard:Make a WorksheetMake a QuizMake a Sub Lesson