Indiana Social Studies P.1.6
The Standard
Define correlation coefficients and explain their appropriate interpretation.
2026 Indiana Academic Standards: K-12 Social Studies
Teacher's field guide
What This Standard Means
What Students Need to Do
- Students define a correlation coefficient as a number from -1 to +1 that describes the direction and strength of a linear relationship. They explain what its sign and size mean for two sets of data.
What Mastery Looks Like
- A student can explain that r = -0.82 shows a strong negative relationship, while r = 0.20 shows a weak positive one. They can say that neither number proves cause and effect.
Common Misconceptions
- Students may think a negative number means a weak relationship. They may think r = 0 rules out every kind of relationship, even a curved one. A strong correlation can also be mistaken for proof that one variable caused the other.
How to Assess It
- Exit ticket: In 20 towns, r = -0.82 for distance from a railroad station and number of factories. Describe the relationship and say whether the number proves that station distance caused the difference.
Lesson moves
Ways to Teach It
Plot these study-hour and quiz-score pairs on graph paper: (1,50), (2,65), (3,60), (4,85), (5,90). Estimate the sign and strength of r.
Ask: If factory jobs and city populations rose together from 1900 to 1920, does that prove factories caused population growth?
Give pairs of r values, such as -0.85 and 0.40. Students choose the stronger relationship and explain each sign.
Use a printed 1900 to 1950 census table of year and urban population. Ask whether a positive r explains why cities grew.
Free download
Printable P.1.6 Worksheet
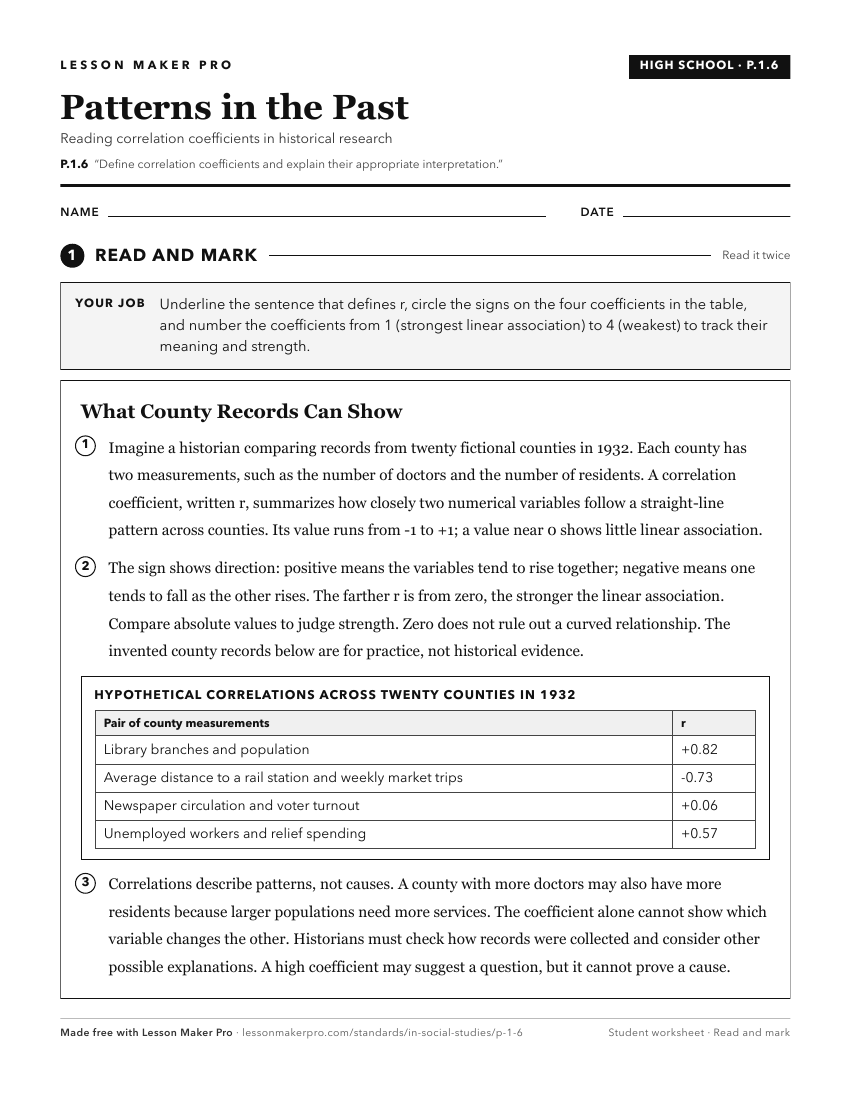
A ready-to-print activity worksheet aligned to P.1.6, with an answer key for the teacher on its own page. No account needed.
PDF, US Letter, prints cleanly in black and white.
Download the worksheetKeep exploring
Related Standards
- 6.H.14
Differentiate between fact and interpretation in historical accounts and explain the meaning of historical passages by identifying who was involved, what happen...
- P.1.2
Differentiate between research methods including descriptive, correlational, and experimental methods, decide when to use each, and differentiate between correl...
- 4.G.1
Estimate distances between two places on a map when referring to relative locations.
- 2.G.3
Compare neighborhoods in the local community or region, and explain how physical features of the community affect people living there.
Turn this exact standard into a lesson
Grade, subject, topic, and the complete standard are prefilled. Create one free, no account needed.
Also for this standard:Make a WorksheetMake a QuizMake a Sub Lesson