Indiana Social Studies E.1.5
The Standard
Use a production possibilities curve to explain the concepts of choice, scarcity, opportunity cost, trade offs, efficiency, productivity, and growth.
2026 Indiana Academic Standards: K-12 Social Studies · Students explain that because resources are limited, people must make choices, understanding the role that supply, demand, prices, and profits play in a market economy. Key elements of the course include study of scarcity and economic reasoning, supply and demand, market structures, the role of government, national economic performance, the role of financial institutions, economic stabilization, and trade.
Teacher's field guide
What This Standard Means
What Students Need to Do
- Students graph the maximum combinations of two goods possible with limited resources. They explain why making more of one good can mean making less of the other. They show how more productive work can expand what is possible.
What Mastery Looks Like
- A student labels a point on the curve efficient, a point inside it inefficient, and a point outside it unattainable for now. They calculate what must be given up to make more of one good. They sketch an outward shift after a productivity gain.
Common Misconceptions
- Students may call a point inside the curve impossible, rather than possible but inefficient. They may think choosing a different point on the curve creates growth. Some count all of the second good as the opportunity cost, rather than only the units given up.
How to Assess It
- Exit ticket: A cafeteria's sandwich and salad frontier includes (4,7) and (6,4). Ask students how many salads the cafeteria gives up to make two more sandwiches, then have them sketch how a faster kitchen could change the curve.
Lesson moves
Ways to Teach It
Give pairs graph paper and sandwich-salad output cards marked (0,10), (2,9), (4,7), (6,4), and (8,0); have them plot and connect the points.
Ask: If the cafeteria moves from (4,7) to (6,4), what does it gain, and what does it give up?
Play On, In, or Out: display (4,7), (4,5), and (8,4); students hold up labeled cards and explain each choice.
Show a bakery menu with bread and cookies; ask students to sketch how adding a second oven could shift its output curve.
Free download
Printable E.1.5 Worksheet
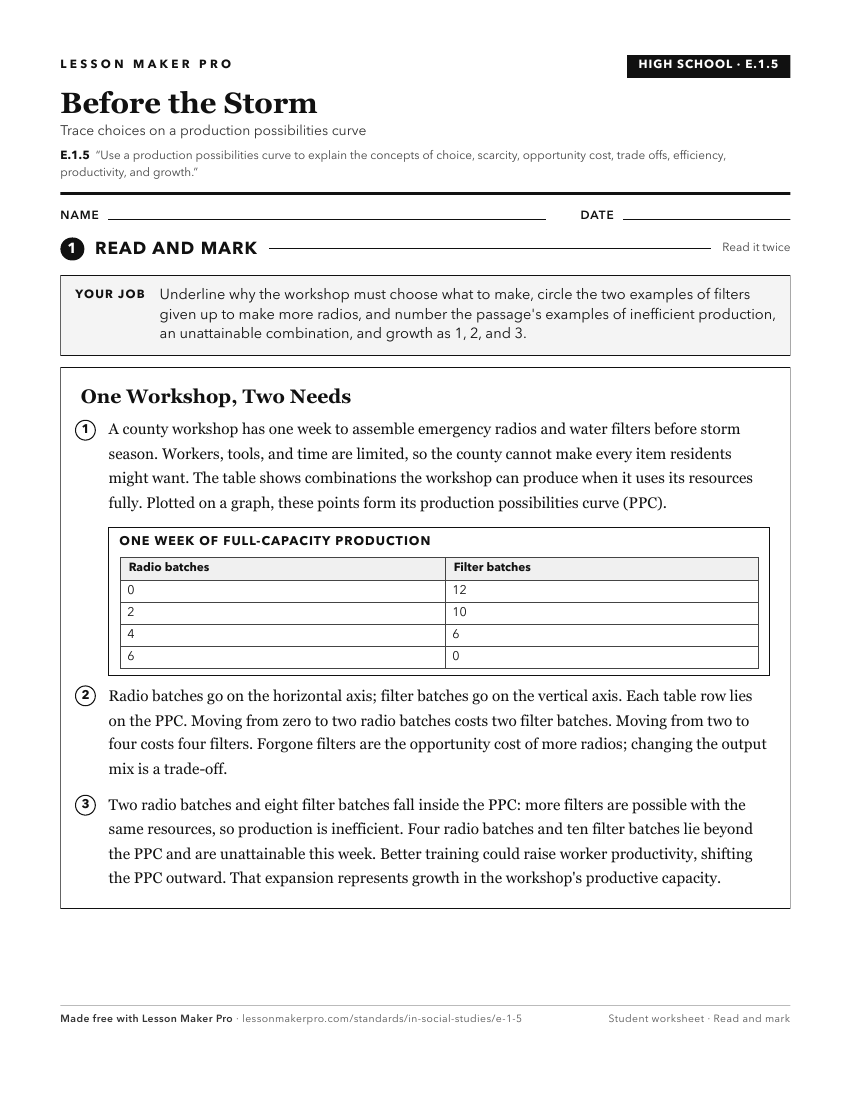
A ready-to-print activity worksheet aligned to E.1.5, with an answer key for the teacher on its own page. No account needed.
PDF, US Letter, prints cleanly in black and white.
Download the worksheetKeep exploring
Related Standards
- E.1.4
Define scarcity, and explain how choices incur opportunity costs, utility, and trade-offs.
- GE.1.2
Define scarcity and explain how opportunity costs and tradeoffs exist.
- 2.E.3
Define opportunity cost and explain that because resources are limited in relation to people’s wants (e.g., scarcity), people must make choices as to how to use...
- GE.1.4
Illustrate a production possibilities curve to explain the concepts of choice, scarcity, opportunity cost, trade-offs, unemployment, productivity, and growth.
Turn this exact standard into a lesson
Grade, subject, topic, and the complete standard are prefilled. Create one free, no account needed.
Also for this standard:Make a WorksheetMake a QuizMake a Sub Lesson